


Autors: Zhongxiao Sun, Laura Scherer, Qian Zhang & Paul Behrens
Abstract
Crises related to extreme weather events, COVID-19 and the Russia–Ukraine conflict have revealed serious problems in global food (inter)dependency. Here we demonstrate that a transition towards the EAT-Lancet’s planetary health diet in the European Union and the United Kingdom alone would almost compensate for all production deficits from Russia and Ukraine while yielding improvements in blue water use (4.1 Gm3 yr−1), greenhouse gas emissions (0.22 GtCO2e yr−1) and carbon sequestration (17.4 GtCO2e).
Main
The global food system has faced multiple unprecedented threats and supply-chain interruptions in recent years, including COVID-19, locust plagues and climate extremes1,2,3. With a food system already under pressure and food insecurity rising even before COVID-19, the Russia–Ukraine conflict has caused a further shock, resulting in record food price increases. Russia and Ukraine are important producers and exporters of barley, wheat, maize, sunflower seed and rapeseed4. Together they supplied 64% and 28% of global sunflower oil and wheat exports, respectively, in 20215. In addition, Russia is a major producer and exporter of fertilizer, accounting for almost 20% of global fertilizer exports in 20215.
Ukraine is often described as the European Union’s breadbasket, and the European Union is heavily exposed to this conflict-driven food shock. Recent work estimates that a 50% grain export reduction from Russia and no Ukrainian exports would increase prices by 4.6% and 7.2% for maize and wheat, respectively6. This shock has also propagated to other countries through international markets, with Indonesia and India banning palm oil and wheat exports, respectively, in an effort to stabilize domestic prices. In May 2022, the International Food Policy Research Institute estimated that over 20 countries have implemented food export bans as a response7. These bans have been driven in regions already facing other substantial pressures, such as Southeast Asia and India. In Southeast Asia, palm oil production slumped due to migrant labour shortages during the first two years of the COVID-19 pandemic. In India, unprecedented spring heat waves, driven by climate change, have curtailed wheat production. Export restrictions will probably cause even greater food insecurity globally. In April 2022, these combined factors, along with food price speculation, drove the food price index of the Food and Agriculture Organization (FAO) above the peak of the 2007–2008 food crisis—a crisis that caused widespread food insecurity and political instability8—and further price increases remain possible, driven by climate extremes during the 2022 northern hemisphere summer.
In March 2022, the European Union aimed to address these emerging pressures by preparing a €500 million package of support for farmers affected by high costs of inputs such as energy and fertilizers, or trade restrictions due to the Russia–Ukraine conflict9. However, many have argued that this support is propping up the overconsumption of animal products rather than food security10. Animal product consumption in EU diets is already substantially higher than in recommended healthy diets and has wide-ranging and deep adverse impacts on human health and the environment11,12,13,14. Perhaps even more concerning is that the policy bolsters the European Union’s own meat-exporting industry, as 60% of imported Ukrainian–Russian crops are used to feed animals that are then exported to the rest of the world as high-value-added exports10. If this support encourages the status quo, incentivizes further production of animal products or drives cropland expansion, it may exacerbate environmental threats and public health concerns10.
Many studies have shown that a move towards more plant-based diets would dramatically reduce environmental impacts11,15,16,17. Here we show that such a move across the European Union and the United Kingdom could also help improve resilience in terms of the capacity to recover from difficulties such as food insecurity driven by the Russia–Ukraine conflict, and that it is possible to harness numerous environmental benefits while filling the gap in overall Ukraine and Russia (UA + RU) crop production for both domestic consumption and exports via EU + UK dietary change to a planetary health diet (based on EAT-Lancet Commission guidance). We use a spatially explicit multiregional input–output approach to investigate the use of spared land, changes in fertilizer use and environmental co-benefits for blue water, green water, carbon emissions and carbon sequestration. This modelling approach allows us to follow crops throughout the global supply chain from producers to consumers, thereby accounting for embodied products in the global supply chain—such as in the case of soybeans produced in Brazil, which are exported to feed cattle in the Netherlands, which are then exported to the United Kingdom for final consumption as beef. We first assess the level of saved crops from a dietary change in the EU + UK (scenario zero, or S0) and then fill any gaps for export crops that would have been produced by UA + RU (S1). We also investigate the ability of these shifts to fill gaps in overall UA + RU production (S2). If saved crops turn out to be insufficient, we assume that these gaps are filled with production on land saved via the transition, for an estimate of the overall savings.
Results
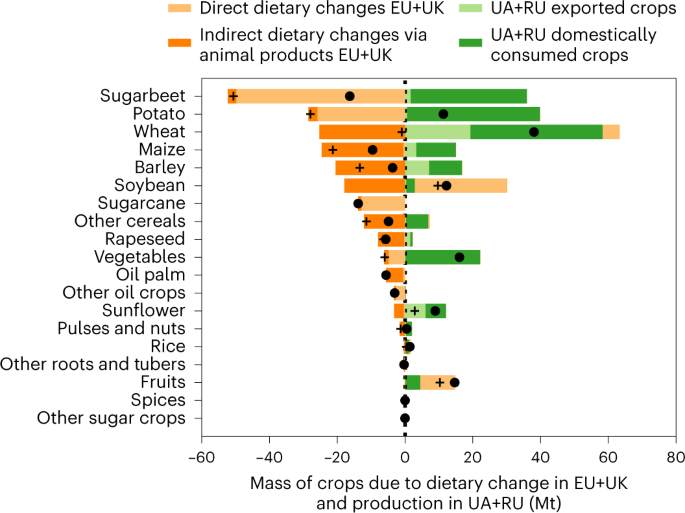
We found that a shift to a planetary health diet in the European Union and the United Kingdom would save a large proportion of crops, mainly by reducing the overconsumption of additive sugar and animal products (Fig. 1). These savings alone would be sufficient to compensate for almost all UA + RU food exports (Fig. 1) (S1), but, to fill all production including food consumed domestically (S2), a small amount of further cultivation of specific crops on the spared agricultural land would be required. In terms of specific crops, the reduction in EU + UK sugar intake fully accounts for all lost UA + RU production (S2). There is a large saving in wheat due to reduced animal feed (see animal-related crops saved in Fig. 1). Dietary change on its own does not result in sufficient savings to offset all UA + RU wheat production (S2): 65.2% of wheat (38.1 Mt) would have to be produced on spared land. However, the saved wheat from such an EU + UK dietary shift (20.2 Mt) would be sufficient to cover the 19.4 Mt of wheat exports lost from UA + RU (S1) and some of this saved wheat, when redirected to international markets, would make up for the shortfall (S2). Given that prices are set on global food commodity markets, the reduction in demand could reduce prices. There are further large savings in maize, barley, sunflowers and rapeseed from the reduction in animal product consumption, and potatoes through reducing direct consumption. While EU + UK dietary change would yield large savings in rapeseed compared with UA + RU production, it would be insufficient for sunflower demand, and some substitution would be necessary.
Land requirements associated with EU + UK food consumption equate to 115 Mha of cropland and 74 Mha of pasture, with around 60% (68.7 Mha) of the cropland being used in animal agriculture. The share of cropland feeding livestock is larger than the global average (∼40%) since the European Union and the United Kingdom together consume more animal products per capita than the global average and have a strong export market in high-value animal products18. As such, there is an opportunity from dietary change to save 70.7 Mha of agricultural land, close to the size of France and the United Kingdom combined (S0). To replace all UA + RU crops (S2), 25.2% of this spared land would be needed. Around 12.9% of the saved land would be required to replace exports only (S1) (perhaps keeping prices stable). Other work suggests the global crop area would need to increase by 11.1 Mha to replace Ukraine grain crop exports alone, similar to our estimates6. If all spared land was restored to antecedent natural vegetation, we would see a broad swathe of environmental benefits, including reductions in emissions (0.25 GtCO2e yr−1) and blue water consumption (7.9bn m3 yr−1) (S0) (Supplementary Fig. 2). There is an additional carbon sequestration opportunity, defined as a one-time committed mass of carbon that is restored over the long term16,19, of 38.3 GtCO2e (23.1 GtCO2e aboveground (AGBC), 10.8 GtCO2e belowground (BGBC) and 4.4 GtCO2e soil organic carbon (SOC)) (S0) (Supplementary Fig. 2). Replacing exported crops only (S1) would offset these total benefits by 1% of blue water, 16.3% of carbon sequestration and 4.1% of greenhouse gas (GHG) emission savings (Supplementary Fig. 3). Replacing all UA + RU crops (S2) would offset more benefits, reducing the total savings by 48.4% for blue water, 54.5% for carbon sequestration and 10.0% for GHG emissions (Supplementary Fig. 4).
EU + UK dietary change would reduce 2.1% of global agricultural fertilizer use and 23.4% of EU + UK fertilizer use, split by 2.5 Mt nitrogen (N), 0.7 Mt potash (K2O) and 0.5 Mt phosphate (P2O5) (S0) (Supplementary Fig. 5). Replacing just the exports (S1) would offset these savings by 39.7% of N, 42.3% of P2O5 and 10.9% of K2O (Supplementary Fig. 6). Replacing all UA + RU crops (S2) would offset total savings by 85.8% for N, 86.6% for P2O5 and 72.7% for K2O (Supplementary Fig. 7).
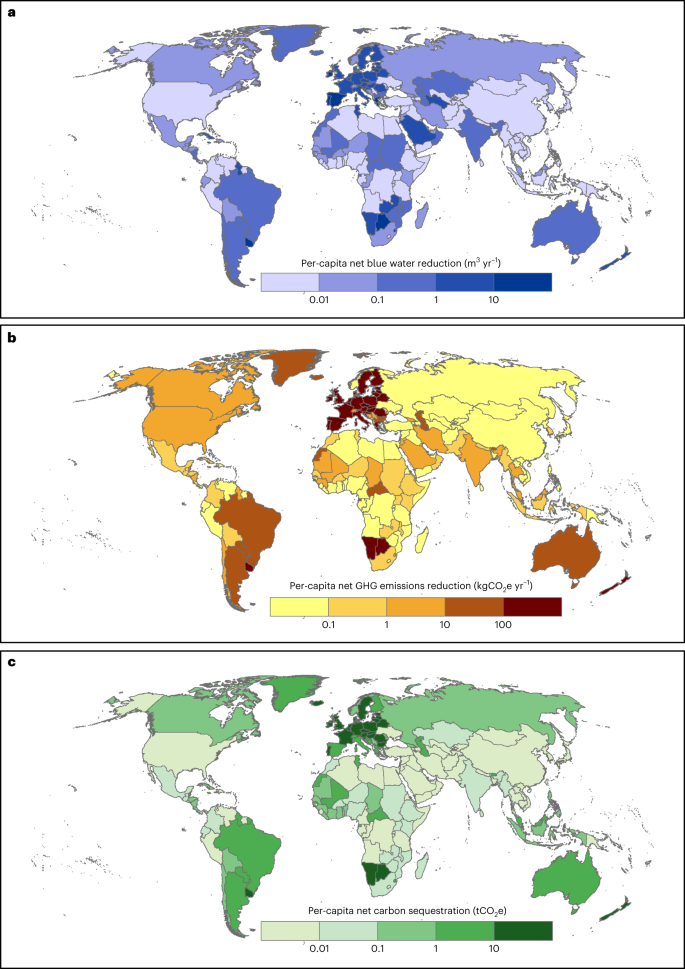
Regionally, benefits would be located predominantly in the European Union and the United Kingdom with large amounts of agricultural production, especially with respect to crops for animal feed and pasture (savings are a combination of population, consumption shifts and specializations in production). From a per-capita perspective, EU + UK countries and countries which see regular EU + UK agricultural trade with lower population densities see the largest benefits (Fig. 2). For instance, Ireland would see the largest mitigation of GHGs, with 2691 kgCO2e yr−1 per capita (S0). Another interesting example is cattle rearing in Botswana which exports mainly to the European Union and the United Kingdom. Botswana would increase the most carbon sequestration, with 466 tCO2e per capita (S0).
Dietary change from current diets to the EAT-Lancet diet would not only benefit planetary and human health but could also help absorb interruptions in the international food supply. Such a dietary shift in the European Union and the United Kingdom can fill the gap in UA + RU crop production while reducing fertilizer use, water consumption and GHG emissions, and increasing carbon sequestration. A planetary health diet with a high proportion of nutrient-dense crops could help build more resilient and sustainable agrifood systems in the long-term20,21. Such shifts imply large changes in agricultural employment worldwide as changes in consumption ripple through supply chains. Future work would benefit from high-resolution global employment data both spatially and by crop and could explore how planetary health diets transform agricultural employment across the world.
However, there are many social barriers to the widespread adoption of such diets which may include expense, cultural norms and knowledge about healthy diets. It is not clear whether plant-rich diets are more or less expensive than alternatives, but it is clear that current subsidies artificially reduce the cost of animal-rich diets both directly in monetary terms and indirectly as externalities22. Yet even lower participation rates in planetary diet adoption can make a large difference. If the European Union and the United Kingdom reduced meat consumption 20%, the saved crops could replace most crops exported by Ukraine and Russia except for sunflower (covering only 11% of UA + RU exports), wheat (33%) and barley (72%) (Supplementary Fig. 13). If 50% of people engaged in a planetary diet shift, the saved crops would account for almost all crops exported by Ukraine and Russia (except wheat and sunflower) and would yield a considerable environmental dividend. However, harnessing these opportunities will require a just transition that ensures economically accessible and culturally appropriate food for different groups within and across the European Union and the United Kingdom23,24.
Agriculture currently occupies a large proportion of land, for example, reaching >70% in the United Kingdom25. At present, there is very limited scope for increasing land for cultivation across the European Union and the United Kingdom (even if this was desirable while considering environmental factors). The dietary shift explored here as a response to UA + RU supply shocks could open substantial amounts of land for other uses. However, this may result in a steady state as land is taken out of production, limiting the ability of farmers to flexibly respond to future shocks with increases in production. A simple approach would be to continue with some of today’s food security policies but at a far lower level. For example, a few targeted subsidies could maintain a small percentage of the saved land as available cropland that could be brought into production (at a lower level than the European Union’s current Common Agricultural Policy)26. For comparison, as of 2019, 6% of arable farmland (6.1 Mha) was kept fallow in the 27 EU states27, while the dietary changes investigated here for these countries (not including the UK) would result in a 29% reduction (30.5 Mha). Keeping one-fifth of freed arable land available for further cultivation would allow for the absorption and rapid response to perturbations from food shocks of a similar size as all UA + RU crops, improving resilience overall. Further benefits of such a plant-based shift include many that are seldom modelled holistically: lower probabilities of pandemics, reduced emergence of antimicrobial resistance, limitation and potential reversal of biodiversity loss, improved access to nature, better water quality, improved animal welfare, better air quality, among others11,13,15,28,29.
Methods
We used a physical environmentally extended multiregional input–output (EEMRIO) model to estimate environmental impacts after a dietary shift from national average diets in the year 2010 to a planetary health diet proposed by the EAT-Lancet Commission in the EU27 countries and the United Kingdom16,30. We aim to isolate the current opportunities to absorb a supply chain shock due to UA + RU food production through dietary change across EU + UK nations, assuming other economic conditions are unchanged. We compared the difference before and after the dietary change. As we used a physical input–output model we do not assess price effects, but we have much higher spatial and food-type resolution. We focused on saved crops, fertilizers, blue water, carbon emissions and sequestration. Sequestration distinguishes AGBC, BGBC and SOC of crop and livestock production for human consumption. Carbon emissions and sequestration require two different timeframes: reduced production emissions influence the sector’s annual GHG contribution, while sequestration requires decades or even centuries to realize its full potential. Therefore, we assessed the ‘double dividend’ for emission mitigation from: (1) annual reduced direct agricultural production emissions31 and (2) carbon sequestration via the land sparing over the long term19,32. To keep the geographic data consistent, we aggregated all spatial maps to a uniform resolution of 5 arcmin. We outline the construction of the model for each plant type in turn. We used Python 3.8.12 for general data analysis and ArcGIS 10.6.1, including its Spatial Analyst Toolbox, to deal with spatial datasets.
Given that one unit of land use cannot play roles in both crop production and restoration to potential natural vegetation, we deducted crops produced in Russia and Ukraine first and then redistributed agricultural land to produce crops that either see increases due to diet or are restored to their potential natural vegetation. In addition, to ensure that spared EU + UK agricultural land can be used to cultivate crops lost in Russia and Ukraine, we assumed that crops requiring an increase in output can only be planted in grid cells where those crops are currently planted16.
Dietary change in EU + UK countries
To model dietary change across the the European Union and the United Kingdom, we used the difference between average national diets derived from FAO food balance sheets (FBSs) and the EAT-Lancet diet per person per day scaled by population in the year 2010. Production losses are accounted for in FAOSTAT and FABIO data (see below), and we adopted consumer waste percentages for specific food items and nations from a previous study to isolate dietary consumption changes33. The EAT-Lancet diet is a universal healthy reference diet recommended by the EAT-Lancet Commission, representing benefits to both human and planetary health. It is most appropriate for regions with access to plant-based proteins, such as the high-income nations we model here. The EAT-Lancet Commission recommended caloric energy intake (measured in kcal) and possible ranges for mass intake (measured in grams) for 8 food groups and 14 subgroups, with a total energy intake of 2500 kcal per capita per day30. Here, we used nine food groups where the ‘proteins’ group in the EAT-Lancet diet was split into ‘animal proteins’ and ‘plant proteins’ (Supplementary Table 1). To guarantee diets can reach the recommendation for each food group and maintain the original diet structure to the maximum extent for each country (given different food cultures), we adjusted food items proportionally based on average national diets from FBSs16,31,34. FBSs provide the mass of food items expressed in primary commodity equivalent; therefore, we used calories (kilocalories per person per day) and mass (grams per person per day) to calculate unit energy per gram of food items in FBSs. Subsequently we converted the recommended energy intake for each group into mass based on the unit energy for each food item in every EU country and the United Kingdom. Further details are available in previous work16. Finally, we calculate the differences between the current average national diets and the EAT-Lancet diet (Supplementary Table 2).
EEMRIO model
We used a consistent, balanced, physical input–output database—the Food and Agriculture Biomass Input–Output model (FABIO)—including 192 countries and regions and 128 agriculture, food and forestry products in the year 2010 for this study35. FABIO follows the same approach as EEMRIO models which have been widely used to assess physical flows of environmental impacts driven by global consumption. For a detailed description of FABIO see Bruckner et al.35. Environmental impact change due to dietary change in the European Union and the United Kingdom can be described as follows:
ΔF=diag(e)(I−A)−1(ΔY)ΔF=diag(e)(I−A)−1(ΔY)
ΔF is environmental impact change driven by final demand change in every country, with 24,576 rows (192 countries/regions and 128 products) and 28 columns representing the countries for which we analysed the dietary shift. e is an environmental impact intensity with 24,576 rows. diag(e) is a square diagonal matrix whose non-zero diagonal element eij is an element of the vector e. In this paper, e stands for the production of crops, fodder and pasture, blue water, fertilizers or GHG emissions of crops, fodder and livestock. A is a matrix of technical coefficients with dimensions 24,576 × 24,576. ΔY is a matrix of food demand change (measured in physical units) in the European Union and the United Kingdom. The vector is the difference between FAOSTAT’s food balance sheets and the EAT-Lancet diet. I is an identity matrix with 24,576 rows and columns.
Blue water
Blue water measures the consumption of freshwater (surface and groundwater)36. The blue water volume is calculated from environmentally extended accounts in FABIO based on ref. 36 for crops, ref. 37 for pasture and ref. 38 for livestock.
Fertilizers
The International Fertilizer Association provides nitrogen, phosphate and potash fertilizer estimates for 13 crop groups and 28 countries or regions in 201039. We allocated these into FABIO’s agricultural and forestry sectors based on the monetary value of crops in each group from FAOSTAT. We calibrated these based on national ‘Nutrient nitrogen N (total)’, ‘Nutrient phosphate P2O5 (total)’ and ‘Nutrient potash K2O (total)’ use and used the results as fertilizer inputs for agricultural production in FABIO.
GHG emissions
The GHG emissions for agricultural production in tonnes of CO2e yr−1 were calculated following the tier 1 methodology of FAOSTAT (in GWP100) for 2010 and applied at the national level rather than the grid cell level16.
Biomass carbon and soil organic carbon
For a detailed description, see Sun et al.16. Biomass carbon, including AGBC and BGBC, of current vegetation were taken from Spawn et al.40. The SOC is from SoilGrid, predicted by machine learning ensemble models at 250 m resolution to a depth of 100 cm (ref. 41). We used 40 crop maps from SPAM42, fodder from EarthStat43 and pasture maps from Sloat et al.44 to extract biomass and SOC values for crop-specific carbon. We used the AGBC and BGBC maps as described above for the current biomass stocks map and used a reduction percentage map from Erb et al.19 to derive the AGBC and BGBC of potential natural vegetation. For the SOC of cropland, we assumed 25% of soil carbon loss in the top 100 cm of soils, consistent with other global studies45,46,47. The SOC difference between pasture and its potential natural vegetation remains disputed. We assume no change in SOC for tropical pastures and 10% loss across temperate pasture, following previous work45. For climate classifications, we employed the latest Köppen–Geiger classification map at a 5 arcmin resolution48. We assume that the SOC of pastures in tropical rainforest, tropical monsoon and tropical savannah climates stays unchanged. We assume that other zones in the Köppen–Geiger climate classification lose 10% and use this assumption to compute the SOC of potential natural vegetation.
Reporting summary
Further information on research design is available in the Nature Research Reporting Summary linked to this article.
Data availability
All secondary, spatially explicit datasets used in this study and an earlier version of the MRIO tables are open access. The FABIO database is freely available via Zenodo (https://doi.org/10.5281/zenodo.2577067), SPAM data can be downloaded from https://www.mapspam.info/ and FBSs are available from FAOSTAT (https://www.fao.org/faostat/en/#data). The source data for Figs. 1 and 2 are available in the Supplementary Information. The MRIO tables and the spatially explicit results from this work are available upon request.
Code availability
The computer code used in this work is available upon request. Code for working with FABIO data in general is available at: https://github.com/fineprint-global/fabio
References
- Laborde, D., Herforth, A., Headey, D. & de Pee, S. COVID-19 pandemic leads to greater depth of unaffordability of healthy and nutrient-adequate diets in low- and middle-income countries. Nat. Food 2, 473–475 (2021).Article CAS Google Scholar
- Laborde, D., Martin, W., Swinnen, J. & Vos, R. COVID-19 risks to global food security. Science 369, 500–502 (2020).Article ADS CAS PubMed Google Scholar
- Salih, A. A., Baraibar, M., Mwangi, K. K. & Artan, G. Climate change and locust outbreak in East Africa. Nat. Clim. Change 10, 584–585 (2020).Article ADS Google Scholar
- Lang, T. & McKee, M. The reinvasion of Ukraine threatens global food supplies. Brit. Med. J. 376, 0676 (2022).Article Google Scholar
- The Importance of Ukraine and the Russian Federation for Global Agricultural Markets and the Risks Associated with the Current Conflict (FAO, 2022).
- Sandström, V. et al. Food system by-products upcycled in livestock and aquaculture feeds can increase global food supply. Nat. Food 3, 729–740 (2022).Article Google Scholar
- Why banning food exports does not work. The Economist (25 May 2022).
- Kornher, L. V. B., Joachim & Algieri, B. Speculation Risks in Food Commodity Markets in the Context of the 2022 Price Spikes—Implications for Policy. ZEF Policy Brief 40 (2022).
- Safeguarding Food Security and Reinforcing the Resilience of Food Systems (European Commission, 2022).
- Pörtner, L. M. et al. We need a food system transformation—in the face of the Russia–Ukraine war, now more than ever. One Earth 5, 470–472 (2022).Article ADS Google Scholar
- Behrens, P. et al. Evaluating the environmental impacts of dietary recommendations. Proc. Natl Acad. Sci. USA 114, 13412–13417 (2017).Article ADS CAS PubMed PubMed Central Google Scholar
- Clark, M. A., Springmann, M., Hill, J. & Tilman, D. Multiple health and environmental impacts of foods. Proc. Natl Acad. Sci. USA 116, 23357–23362 (2019).Article ADS CAS PubMed PubMed Central Google Scholar
- Sun, Z., Behrens, P., Tukker, A., Bruckner, M. & Scherer, L. Global human consumption threatens key biodiversity areas. Environ. Sci. Technol. https://doi.org/10.1021/acs.est.2c00506 (2022).Article PubMed PubMed Central Google Scholar
- Sun, Z., Behrens, P., Tukker, A., Bruckner, M. & Scherer, L. Shared and environmentally just responsibility for global biodiversity loss. Ecol. Econ. 194, 107339 (2022).Article Google Scholar
- Scherer, L., Behrens, P. & Tukker, A. Opportunity for a dietary win–win–win in nutrition, environment, and animal welfare. One Earth 1, 349–360 (2019).Article ADS Google Scholar
- Sun, Z. et al. Dietary change in high-income nations alone can lead to substantial double climate dividend. Nat. Food 3, 29–37 (2022).Article CAS Google Scholar
- Kim, B. F. et al. Country-specific dietary shifts to mitigate climate and water crises. Glob. Environ. Change 62, 101926 (2020).Article Google Scholar
- Mottet, A. et al. Livestock: on our plates or eating at our table? A new analysis of the feed/food debate. Glob. Food Sec. 14, 1–8 (2017).Article Google Scholar
- Erb, K. H. et al. Unexpectedly large impact of forest management and grazing on global vegetation biomass. Nature 553, 73–76 (2018).Article ADS CAS PubMed Google Scholar
- Osendarp, S. et al. Act now before Ukraine war plunges millions into malnutrition. Nature 604, 620–624 (2022).Article ADS CAS PubMed Google Scholar
- Mustafa, M. A., Mabhaudhi, T. & Massawe, F. Building a resilient and sustainable food system in a changing world—a case for climate-smart and nutrient dense crops. Glob. Food Sec. 28, 100477 (2021).Article Google Scholar
- Springmann, M. & Freund, F. Options for reforming agricultural subsidies from health, climate, and economic perspectives. Nat. Commun. 13, 82 (2022).Article ADS CAS PubMed PubMed Central Google Scholar
- Tribaldos, T. & Kortetmäki, T. Just transition principles and criteria for food systems and beyond. Environ. Innov. Soc. Transit. 43, 244–256 (2022).Article Google Scholar
- McGreevy, S. R. et al. Sustainable agrifood systems for a post-growth world. Nat. Sustain. https://doi.org/10.1038/s41893-022-00933-5 (2022).
- Agriculture in the United Kingdom 2021 (Department for Environment Food and Rural Affairs, 2022).
- Strange, N., Geldmann, J., Burgess, N. D. & Bull, J. W. Policy responses to the Ukraine crisis threaten European biodiversity. Nat. Ecol. Evol. 6, 1048–1049 (2022).Article PubMed Google Scholar
- Luckmann, J., Chemnitz, C. & Luckmann, O. Effects of a Change to Fallow land in the EU on the Global Grain Market (Heinrich Böll Foundation, 2022).
- Rohr, J. R. et al. Emerging human infectious diseases and the links to global food production. Nat. Sustain. 2, 445–456 (2019).Article PubMed PubMed Central Google Scholar
- Van Boeckel Thomas, P. et al. Reducing antimicrobial use in food animals. Science 357, 1350–1352 (2017).Article ADS PubMed Google Scholar
- Willett, W. et al. Food in the Anthropocene: the EAT–Lancet Commission on healthy diets from sustainable food systems. Lancet 393, 447–492 (2019).Article PubMed Google Scholar
- Semba, R. D. et al. Adoption of the ‘planetary health diet’ has different impacts on countries’ greenhouse gas emissions. Nat. Food 1, 481–484 (2020).Article Google Scholar
- Hayek, M. N., Harwatt, H., Ripple, W. J. & Mueller, N. D. The carbon opportunity cost of animal-sourced food production on land. Nat. Sustain. https://doi.org/10.1038/s41893-020-00603-4 (2020).
- Coudard, A., Corbin, E., de Koning, J., Tukker, A. & Mogollón, J. M. Global water and energy losses from consumer avoidable food waste. J. Clean. Prod. 326, 129342 (2021).Article Google Scholar
- Laroche, P. C. S. J., Schulp, C. J. E., Kastner, T. & Verburg, P. H. in Global Environmental Change Vol. 62, 102066 (Elsevier, 2020).
- Bruckner, M. et al. FABIO—the construction of the Food and Agriculture Biomass Input–Output Model. Environ. Sci. Technol. 53, 11302–11312 (2019).Article ADS CAS PubMed PubMed Central Google Scholar
- Mekonnen, M. & Hoekstra, A. Y. The green, blue and grey water footprint of crops and derived crop products. Hydrol. Earth Syst. Sci. 15, 1577–1600 (2011).Article ADS Google Scholar
- Mekonnen, M. M. & Hoekstra, A. Y. National Water Footprint Accounts: The Green, Blue and Grey Water Footprint of Production and Consumption. Value of Water Research Report Series No. 50 (UNESCO-IHE Institute for Water Education, 2011).
- Water Use of Livestock Production Systems and Supply Chains—Guidelines for Assessment (FAO, 2018).
- Heffer, P. Assessment of Fertilizer Use by Crop at the Global Level (International Fertilizer Association, 2013).
- Spawn, S. A., Sullivan, C. C., Lark, T. J. & Gibbs, H. K. Harmonized global maps of above and belowground biomass carbon density in the year 2010. Sci. Data https://doi.org/10.1038/s41597-020-0444-4 (2020).
- Poggio, L. et al. SoilGrids 2.0: producing soil information for the globe with quantified spatial uncertainty. Soil 7, 217–240 (2021).Article ADS CAS Google Scholar
- IFPRI Global Spatially-Disaggregated Crop Production Statistics Data for 2010 Version 1.1. Harvard Dataverse, v.3 (IFPRI, 2019); https://doi.org/10.7910/DVN/PRFF8V
- Ramankutty, N., Evan, A. T., Monfreda, C. & Foley, J. A. Farming the planet: 1. Geographic distribution of global agricultural lands in the year 2000. Glob. Biogeochem. Cycles https://doi.org/10.1029/2007GB002952 (2008).Article Google Scholar
- Sloat, L. L. et al. Increasing importance of precipitation variability on global livestock grazing lands. Nat. Clim. Change 8, 214–218 (2018).Article ADS Google Scholar
- Searchinger, T. D., Wirsenius, S., Beringer, T. & Dumas, P. Assessing the efficiency of changes in land use for mitigating climate change. Nature 564, 249–253 (2018).Article ADS CAS PubMed Google Scholar
- West, P. C. et al. Trading carbon for food: global comparison of carbon stocks vs. crop yields on agricultural land. Proc. Natl Acad. Sci. USA 107, 19645–19648 (2010).Article ADS CAS PubMed PubMed Central Google Scholar
- Johnson, J. A., Runge, C. F., Senauer, B., Foley, J. & Polasky, S. Global agriculture and carbon trade-offs. Proc. Natl Acad. Sci. USA 111, 12342–12347 (2014).Article ADS CAS PubMed PubMed Central Google Scholar
- Beck, H. E. et al. Present and future Köppen–Geiger climate classification maps at 1-km resolution. Sci. Data 5, 1–12 (2018).Article ADS Google Scholar
Acknowledgements
Z.S. was funded by the National Natural Science Foundation of China (grant number 52200222), and Q.Z. was funded by the National Natural Science Foundation of China (grant numbers 42271274 and 51861125101).
Author information
Authors and Affiliations
- College of Land Science and Technology, China Agricultural University, Beijing, ChinaZhongxiao Sun & Qian Zhang
- Institute of Environmental Sciences (CML), Leiden University, Leiden, NetherlandsZhongxiao Sun, Laura Scherer & Paul Behrens
- Academy of Global Food Economics and Policy, China Agricultural University, Beijing, ChinaQian Zhang
Contributions
P.B. designed the study. Z.S. performed the analysis. Z.S. and P.B. led the writing, with contributions from L.S. and Q.Z. All authors provided input into the final manuscript.
Corresponding authors
Correspondence to Qian Zhang or Paul Behrens.
Ethics declarations
Competing interests
The authors declare no competing interests.
Peer review
Peer review information
Nature Food thanks Gidon Eshel, Manfred Lenzen and the other, anonymous, reviewer(s) for their contribution to the peer review of this work.
Additional information
Publisher’s note Springer Nature remains neutral with regard to jurisdictional claims in published maps and institutional affiliations.
Supplementary information
Supplementary Information
Supplementary Figs. 1–13.
Reporting Summary
Supplementary Tables 1–4
Supplementary Table 1. Food and energy composition of the EAT-Lancet diet, Supplementary Table 2. Per-capita daily food difference between national average diet and EAT-Lancet diet, Supplementary Table 3. Mapping relationship between FABIO sectors and EAT-Lancet diet groups, Supplementary Table 4. Country Code and ISO3 for countries of FABIO, Supplementary Table 5. Percentage of food waste
Source data
Source Data Fig. 1
Crop change due to dietary change in the EU+UK and total production of crops in Ukraine and Russia.
Source Data Fig. 2
Per capita changes in net water consumption, net GHG emissions and net carbon sequestration due to dietary change in EU+UK after replacing all UA+RU crops.
Rights and permissions
Springer Nature or its licensor (e.g. a society or other partner) holds exclusive rights to this article under a publishing agreement with the author(s) or other rightsholder(s); author self-archiving of the accepted manuscript version of this article is solely governed by the terms of such publishing agreement and applicable law.