

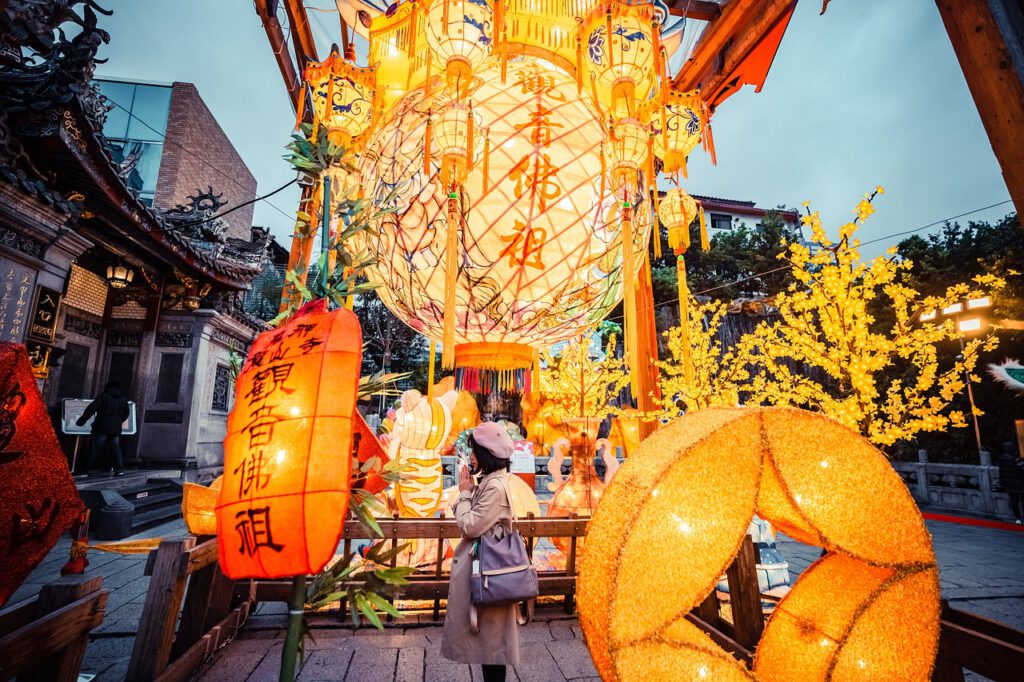
Rot, goldgelb, weiß oder eine andere Farbe? Welche Farbe hat eine gute Ernte? Alles Gute und viel Erfolg im Jahr 2023!
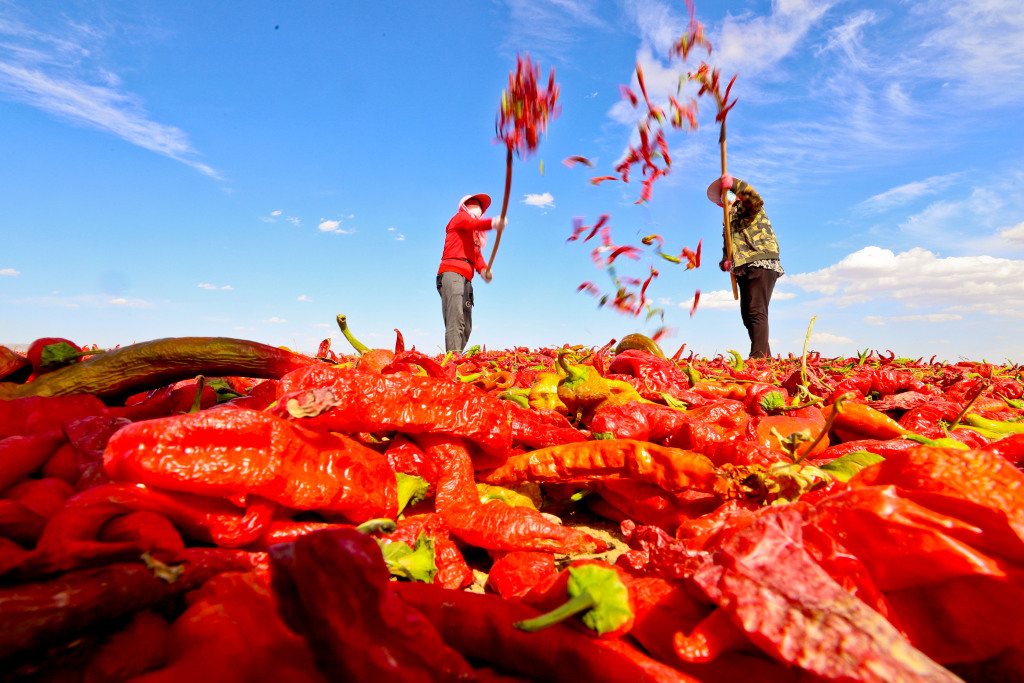
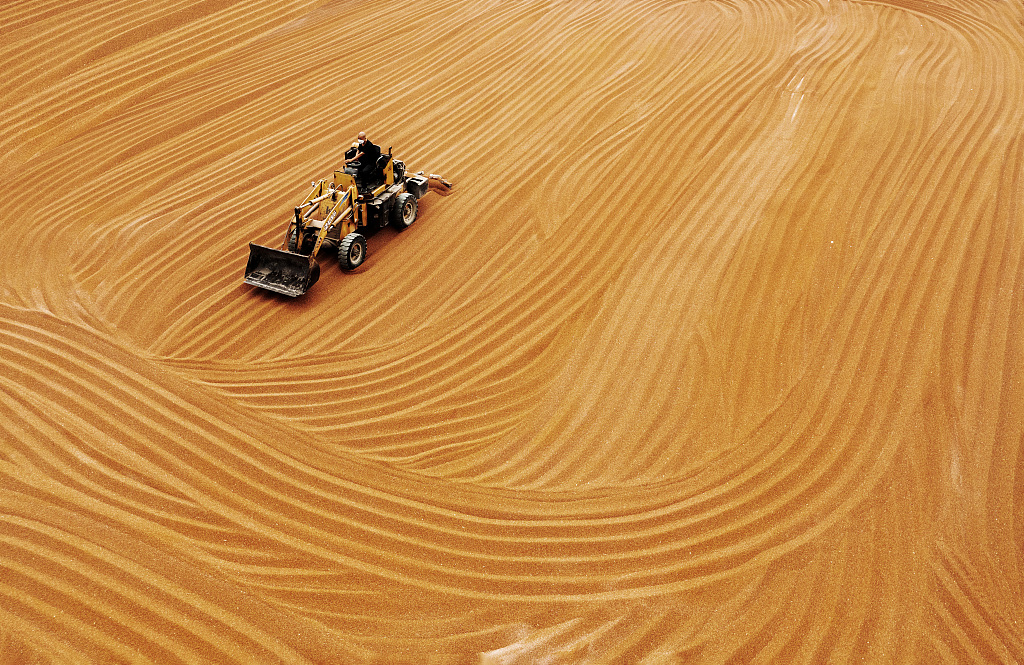
(Quelle: CRI Deutsch, VCG)

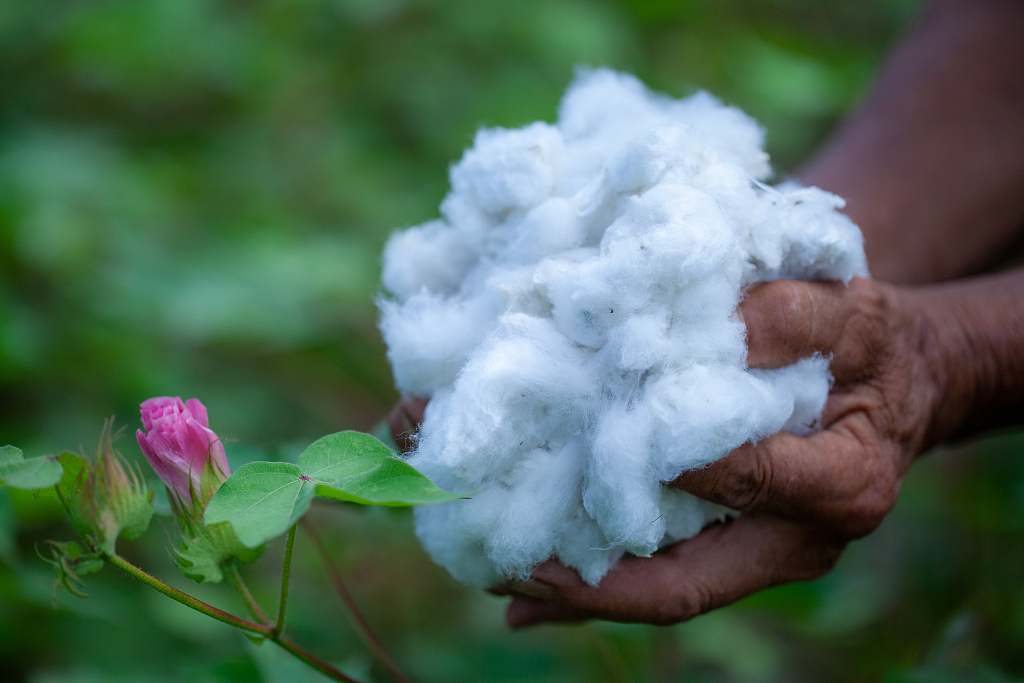
Rot, goldgelb, weiß oder eine andere Farbe? Welche Farbe hat eine gute Ernte? Alles Gute und viel Erfolg im Jahr 2023!
(Quelle: CRI Deutsch, VCG)

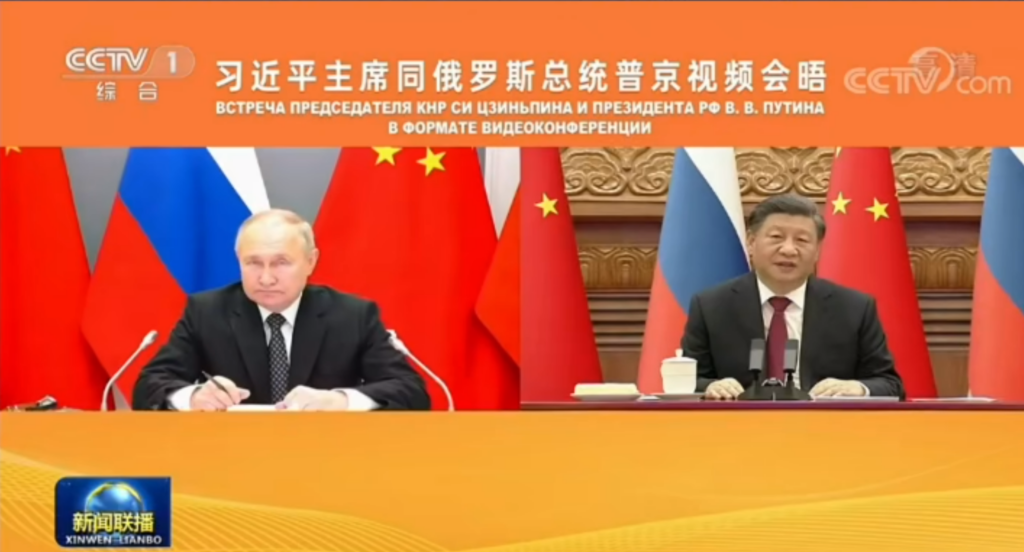
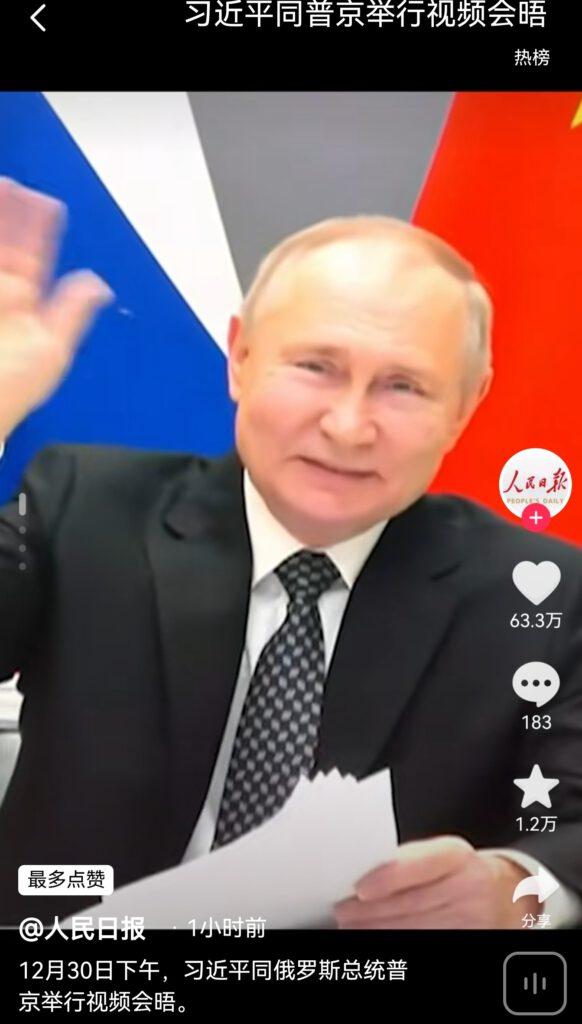
Der chinesische Staatspräsident Xi Jinping hat am Freitagnachmittag ein Videogespräch mit seinem russischen Amtskollegen Wladimir Putin geführt.
Dabei erklärte Xi, er freue sich sehr auf das Videogespräch mit Putin zum Jahresende, was schon zu einer guten Tradition zwischen den beiden Spitzenpolitikern geworden sei. Unter der gemeinsamen Führung von ihnen sei die umfassende strategische kooperative Partnerschaft zwischen China und Russland in der neuen Ära noch reifer und widerstandsfähiger geworden. Die endogene Dynamik und der besondere Wert der bilateralen Zusammenarbeit hätten sich immer stärke hervorgehoben. In den ersten elf Monaten des laufenden Jahres habe das bilaterale Handelsvolumen zwischen einen neuen Rekord aufgestellt, während die Kooperation bei Investitionen ständig optimiert worden sei. Die Zusammenarbeit im Energiebereich habe ihre Rolle als Stabilisator weiterhin ausgespielt.
Auch die Kooperationsprojekte in anderen wichtigen Bereichen seien schrittweise stabil umgesetzt worden. Die Zusammenarbeit zwischen den lokalen Regierungen beider Länder floriere, der Austausch im Bereich der Geisteswissenschaften werde immer enger, und das Jahr des Sportaustauschs werde ordnungsgemäß durchgeführt, sodass sich die sozialen und öffentlichen Grundlagen der Freundschaft zwischen beiden Seiten gefestigt hätten. Angesichts der turbulenten internationalen Lage sollten China und Russland stets an der ursprünglichen Zielvorstellung der Zusammenarbeit festhalten, ihre strategische Entschlossenheit beibehalten, die strategische Zusammenarbeit verstärken, einander als Entwicklungschancen und globale Partner betrachten und danach streben, mehr Nutzen für die beiden Völker zu schaffen und mehr Stabilität in die Welt zu bringen.
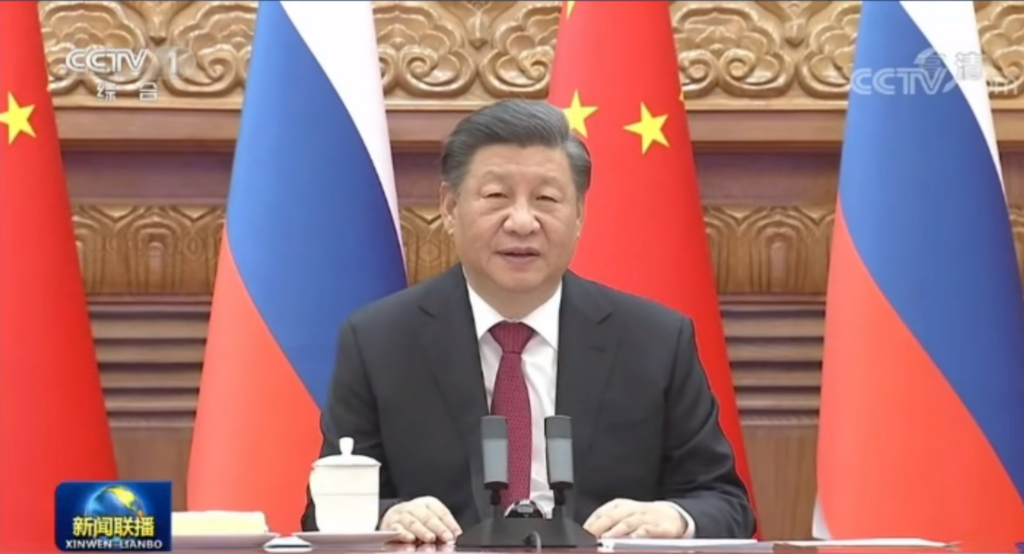
Xi Jinping betonte zudem, dass die Welt derzeit erneut an einem Scheideweg der Geschichte stehe: Ob man zur Mentalität des Kalten Krieges zurückkehre und eine spaltende Konfrontation und Blockkonfrontation provoziere oder ob man Gleichheit, gegenseitigen Respekt und eine für beide Seiten gewinnbringende Zusammenarbeit zum Wohle der Menschheit praktiziere; diese beiden Orientierungen stellten die Weisheit der Politiker der großen Länder und die Vernunft der gesamten Menschheit auf die Probe. China sei bereit, mit Russland und allen fortschrittlichen Kräften auf der ganzen Welt zusammenzuarbeiten, die sich gegen Hegemonismus und Machtpolitik wenden, um Unilateralismus, Protektionismus und Tyrannei zu bekämpfen und die Souveränität, Sicherheit und Entwicklungsinteressen beider Länder sowie internationale Gerechtigkeit und Gleichheit entschlossen zu verteidigen. Beide Seiten sollten sich in internationalen Angelegenheiten eng abstimmen, die Autorität der Vereinten Nationen und den Status des Völkerrechts aufrechterhalten und einen echten Multilateralismus gewährleisten. Beide Seiten sollten weiterhin eine größere Einheit und gegenseitiges Vertrauen zwischen allen Parteien in der Shanghaier Organisation für Zusammenarbeit (SCO) fördern, die gegenseitige Unterstützung in Fragen, die die Kerninteressen der jeweils anderen Seite betreffen, verstärken und sich gemeinsam gegen Einmischung und Sabotage durch externe Kräfte wehren. Die Zusammenarbeit der BRICS-Staaten sei voller Höhepunkte, die die Attraktivität und die glänzenden Aussichten der BRICS-Staaten deutlich machten. China sei bereit, mit der russischen Seite zusammenzuarbeiten, um die Erweiterung der BRICS-Mitgliedschaft aktiv zu fördern und die gemeinsamen Interessen der Schwellen- und Entwicklungsländer zu wahren.
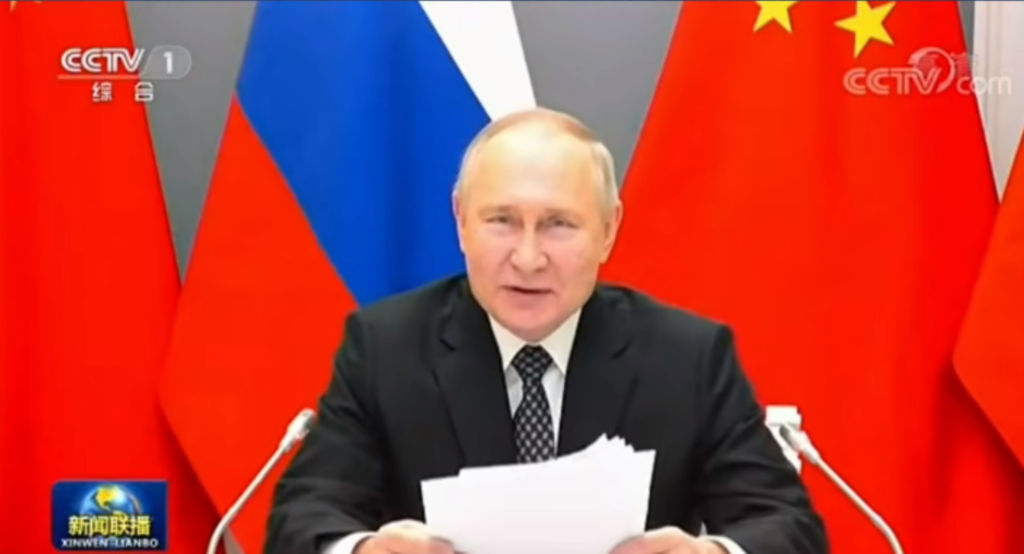
Die beiden Spitzenpolitiker tauschten sich auch über die Krise in der Ukraine aus. Xi Jinping betonte, China habe zur Kenntnis genommen, dass die russische Seite eine diplomatische Lösung des Konflikts auf dem Verhandlungsweg nie abgelehnt habe, was China zu schätzen wisse. Der Weg zu Friedensgesprächen werde nicht glatt verlaufen, aber solange die Bemühungen nicht aufgegeben werden, werde es immer eine Aussicht auf Frieden geben. China werde auch weiterhin eine objektive und unparteiische Position einnehmen und die internationale Gemeinschaft darin bestärken, gemeinsame Anstrengungen zu unternehmen, um eine konstruktive Rolle bei der friedlichen Beilegung der Krise in der Ukraine zu spielen.
(Quelle: CRI Deutsch, CCTV)

Die Ursprünge des Tees gehen auf das antike China vor fast 5.000 Jahren zurück, als Tee für die Chinesen vor allem eine Art Medizin war. Heute werden Yin-Tees, zum Beispiel grüner Tee, immer noch dem Frühling und Sommer zugeordnet und Yang-Tees dem Herbst und Winter. Ratschläge und Erläuterungen.
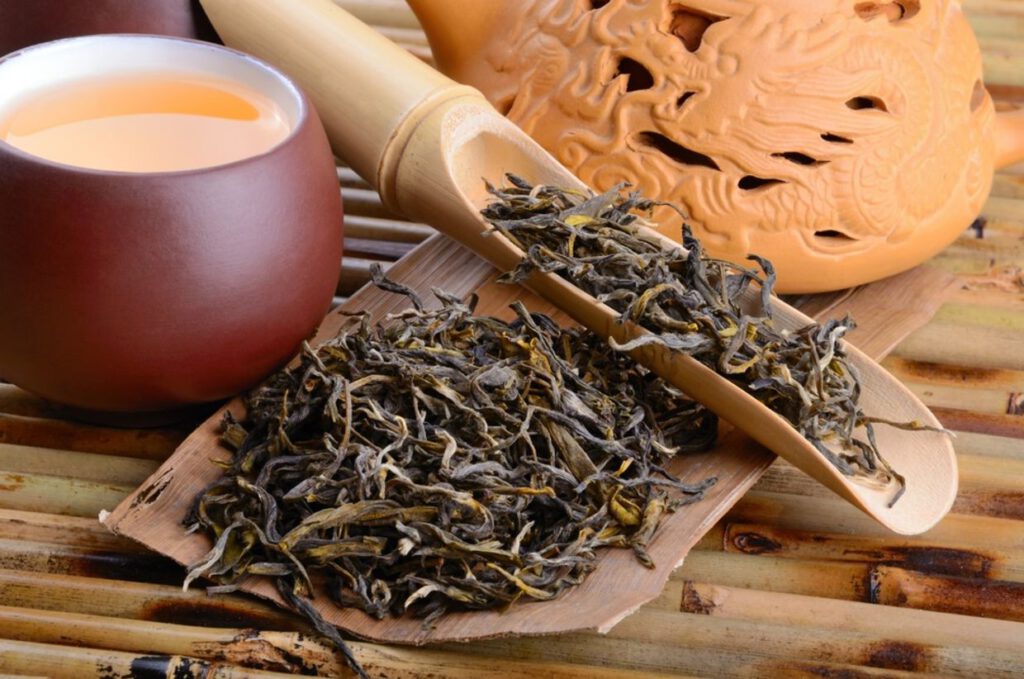
Heute ist Tee nach Wasser nicht nur das am meisten konsumierte Getränk der Welt, sondern auch ein uraltes Ritual, das eng mit Kultur, Gesundheit und Menschen verbunden ist. Und obwohl der chinesische Tee die älteste und reichhaltigste aller Teesorten ist, wird er in den europäischen Ländern immer noch zu selten erwähnt.
Einer der Vorteile der chinesischen Tees ist ihre heilende Wirkung. Nach der traditionellen chinesischen Medizin werden Tees die Eigenschaften Hanliang („kühlend“) oder Shanghuo („wärmend“) zugeschrieben.
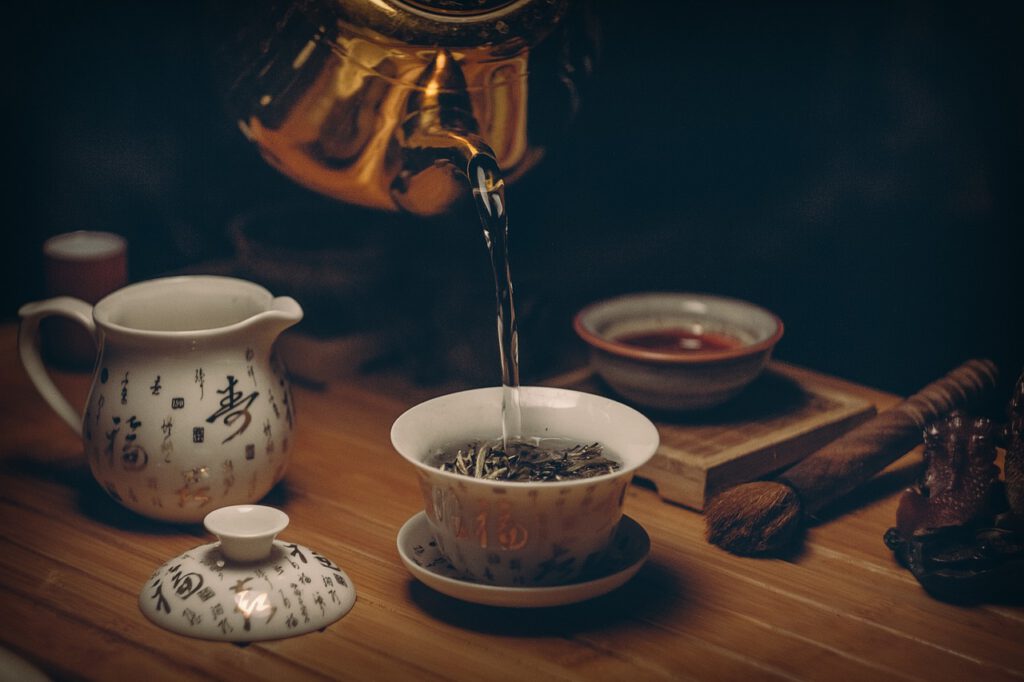
Jetzt in der kalten Jahreszeit gibt es von LHCH drei Empfehlungen für chinesische Tees, die uns in den Wintermonaten warm halten.
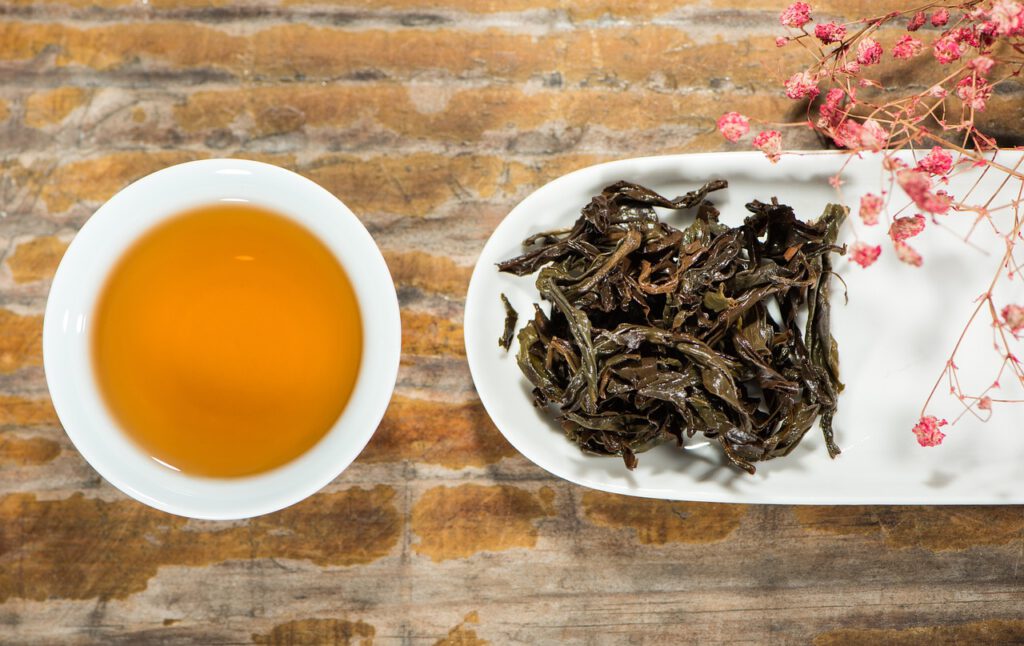
Ein schwarzer Tee aus Qimen
Nach der Theorie der traditionellen chinesischen Medizin „wärmt“ roter Tee und der Tee aus Qimen („Keemun“) in der Provinz Anhui ist einer der besten schwarzen Tees, die Sie bekommen können, mit einer tiefen und zarten Süße. Der „Keemun“ Xiangluo zum Beispiel ist malzig und fruchtig.
Ein alter weißer Tee?
Während weißer Tee traditionell als erfrischender gilt, ist gealterter weißer Tee, wie z.B. ein runder „Weiße Pfingstrose“-Teekuchen, fluffiger und hat eine süße Fruchtigkeit und dickere Textur, die an kalten Wintertagen besonders beruhigend ist.
Aber der Winterkönig ist …
der Shu Pu’er, der einen Fermentationsprozess durchläuft, der als „nasses Stapeln“ oder schnelle Reifung bezeichnet wird. Es ist ein sehr „wärmender“ Tee, von dem man annimmt, dass er den Kreislauf und die Gesundheit der Verdauung unterstützt. Vergessen Sie den Ruf eines leicht muffigen Geschmacks. Wählen Sie einen guten Pfannkuchen mit den medizinischen Tugenden von Yunnan. Einige haben einen einzigartigen Reisgeschmack, der an das Frühstück mit Reissuppe „congee“ erinnert.

Chinas Handel mit anderen Mitgliedern der Regional Comprehensive Economic Partnership (RCEP) ist seit Anfang dieses Jahres weiterhin relativ schnell gewachsen.
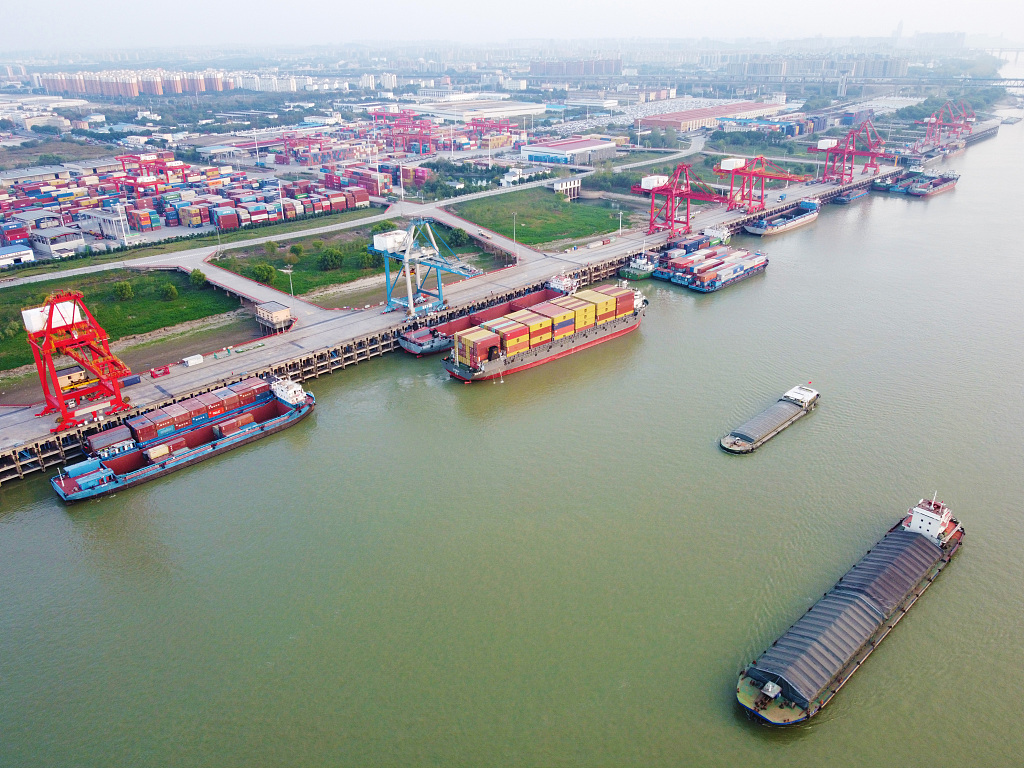
Den Statistiken der chinesischen Zollbehörde zufolge belief sich Chinas Handelsvolumen mit anderen RCEP-Mitgliedern von Januar bis November dieses Jahres auf 11,8 Billionen Yuan RMB, was einem Anstieg von 7,9 Prozent gegenüber dem Vorjahr entspricht. Es machte 30,7 Prozent des gesamten Handelsvolumens Chinas aus. Darunter erreichten die chinesischen Exporte in andere Länder der RCEP-Mitglieder 6,0 Billionen Yuan RMB, was einem Anstieg von 17,7 Prozent gegenüber dem Vorjahr entspricht. Die Wachstumsrate beträgt 5,8 Prozentpunkte mehr als die der gesamten Exporte Chinas.
Ein Sprecher des Handelsministeriums sagte am Donnerstag vor der Presse, China werde in Zukunft mit mehr Handelspartnern Freihandelsabkommen unterzeichnen und sein Netz von Freihandelszonen mit hohem Standard für die Welt ausbauen.
(Quelle: CRI Deutsch, VCG)
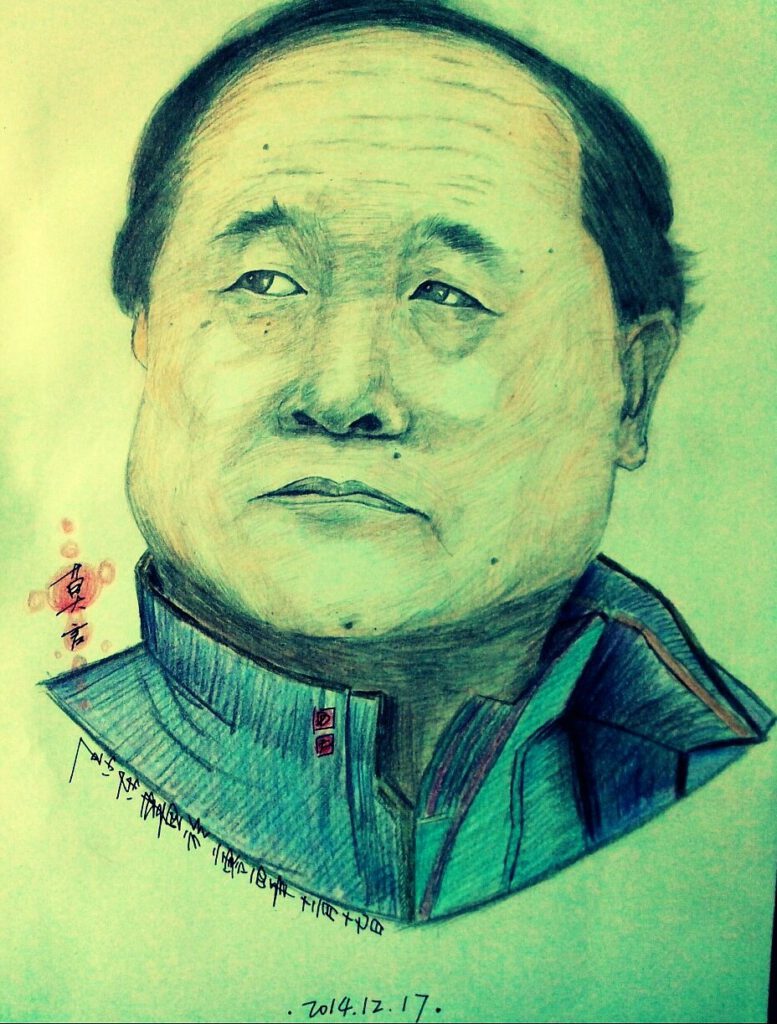
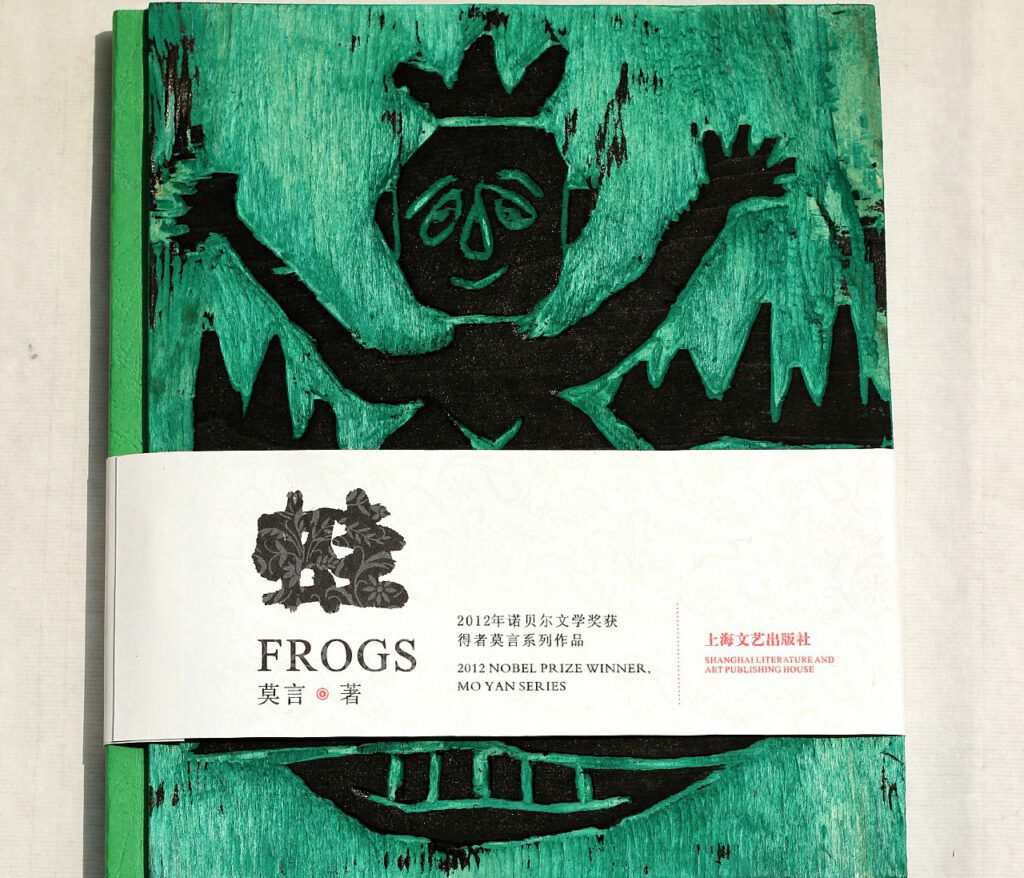
entdecken: MO YAN")
Mo Yan, der berühmte chinesische Schriftsteller und Träger des Literaturnobelpreises, der vor gerade einmal 10 Jahren, 2012, seinen offiziellen Blog auf WeChat ins Leben rief, um, wie er sagte, „mit jungen Menschen zu kommunizieren“. Dies ist eine Nachricht, die uns einlädt, diesen großen, in Europa manchmal missverstandenen Schriftsteller neu zu entdecken.
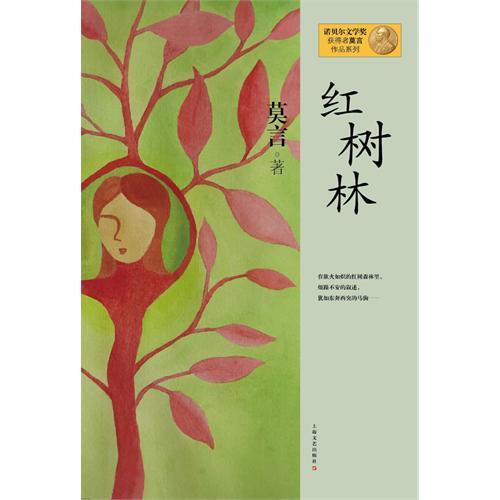
Mo Yan, der unter dem Pseudonym „der Stumme“ (richtiger Name Guan Moye) schreibt, begann in den 1980er Jahren zu schreiben. Bekannt wurde er mit Romanen wie Die dreizehn Schritte (1989) und „ Das Land des Alkohols „ (1993) oder auch Schöne Brüste, wohlgeformte Pobacken (1995). Mo Yan hat ein sehr umfangreiches Werk geschaffen: mehr als hundert Romane, Kurzgeschichten oder Essays, von denen fünfzehn ins Englische und Deutsche übersetzt wurden.
Was gibt es da Neues nach all dieser Zeit? Er ist eine Goldgrube für Europäer, die Chinesisch lernen. Mo Yan hat ein kurzes Video auf WeChat aufgenommen, in dem er sich vorstellt und seine Erwartungen an diesen Account erläutert. Humorvoll registrierte er sich sogar als „66-jähriger junger Mann“, während er sich selbst als jemanden beschrieb, der „viel isst, wenig schläft und viel Energie hat“.
Mo Yan kündigte außerdem an, dass er von nun an jeden Montag um 22.00 Uhr zwei Artikel veröffentlichen werde, einen mit seinen Texten und den anderen in Form einer Sprachaufnahme.
Eine erfolgreiche Strategie, denn nur wenige Stunden nach der Ankündigung des Starts seines WeChat-Kontos waren seine Artikel bereits mehr als 100.000 Mal aufgerufen worden.
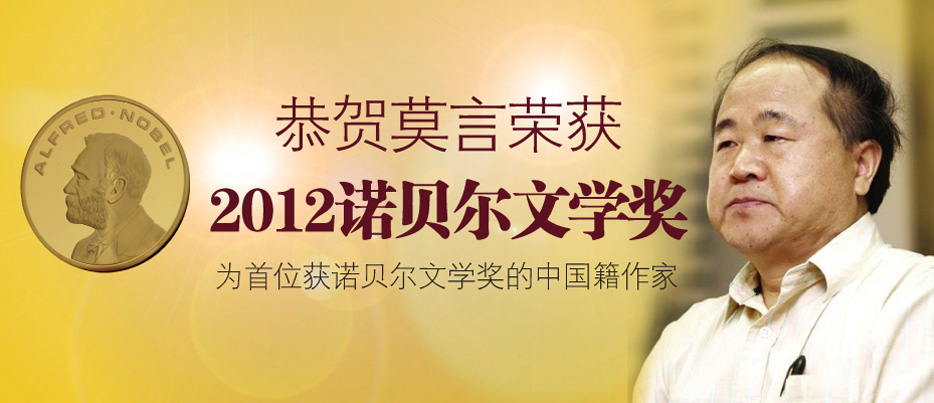
In einer berühmten Aussage verteidigte der chinesische Schriftsteller Mo Yan, als er 2012 in Stockholm den Literaturnobelpreis entgegennahm, die Zensur, indem er sie mit der Sicherheitskontrolle am Flughafen verglich: Sie kann lästig sein, ist aber für die öffentliche Sicherheit notwendig.
Daher die Unzufriedenheit hier in Europa. Wir gehen in diesem Artikel nicht auf politische Fragen ein, aber es ist an der Zeit, diesem großen Schriftsteller gerecht zu werden, der, wenn er es für richtig hält, auch über die Dinge sprechen kann, die in China falsch laufen. Aber vor allem erzählt Mo Yan vom Landleben, vom harten, schwierigen, aber auch authentischen Leben der Bauern.
Guan Moye, so sein richtiger Name, wurde 1955 in einer Bauernfamilie in Shandong geboren. Von 1959 bis 1975 war sein Leben in dieser Region hart: Armut und dann Arbeit in einer Fabrik. Aber 1976 schloss er sich der Volksbefreiungsarmee an und wurde dann Mitglied der Partei. Was uns hier interessiert, ist, dass Mo Yan 1986 seinen Abschluss am People’s Liberation Army Institute of Arts and Letters und 1991 an der Beijing Normal University gemacht hat.
Seine bäuerliche Herkunft, über die Mo Yan die Rolle der Erzählungen seiner Großmutter heraufbeschwört, und seine Ausbildung in der Armee stehen im Gegensatz zu vielen anderen Schriftstellern, die von der Lektüre der großen klassischen Romane geprägt sind.
Seine Eltern brachten ihm vorsichtshalber bei, draußen den Mund zu halten. Dies ist der Grund für die Wahl seines Pseudonyms Mo Yan, „Derjenige, der nicht spricht“.
1981 veröffentlichte er seine erste Kurzgeschichte, Radis de cristal, und nahm seinen Künstlernamen Mo Yan an. Die Anerkennung folgte bald, aber erst mit „Le Clan du sorghum“, der 1986 von Zhang Yimou als „Red Sorghum“ verfilmt wurde, erlangte er in Europa Bekanntheit.
Mo Yan schied 1999 aus der Armee aus, wo er zuvor in der Kulturabteilung gearbeitet hatte.
Der Literaturnobelpreis wurde 2012 an Mo Yan für seinen „halluzinatorischen Realismus, der Erzählung, Geschichte und Gegenwart miteinander verbindet“ verliehen, so die Schwedische Akademie.
Seine Arbeit steht im Zusammenhang mit der „Quest for Roots“-Bewegung. Mit „Der rote Sorghum-Clan „ ruft er die Geschichte seiner Heimatprovinz Shandong aus historischer Sicht ins Gedächtnis. „(1986), politisch, mit „Knoblauchballaden“ (1988), oder ethnologisch. Das Autobiografische nimmt darin eine wichtige Rolle ein. Auf formaler Ebene verschmäht es sein realistisches Schreiben nicht, an den Humor zu appellieren.
Er ist heute einer der berühmtesten Schriftsteller in China und im Ausland. Sein Stil zeichnet sich durch einen sehr freien Umgang mit Themen wie Sex, Macht und Politik aus. Er beschreibt freimütig, aber nicht ohne Humor die psychischen und physischen Irrwege des zeitgenössischen China. Seine Intelligenz und seine Interpretation des zeitgenössischen Chinas erklären wahrscheinlich, warum er nie zensiert wurde – abgesehen von bestimmten Passagen in den ersten Ausgaben von „Schöne Brüste, wohlgeformte Pobacken“.

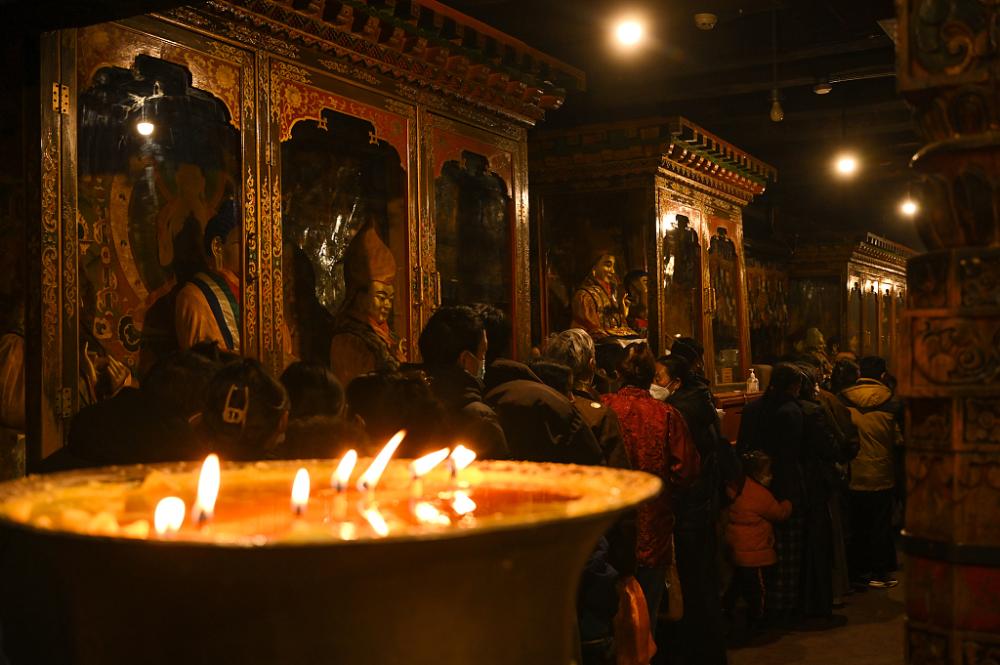
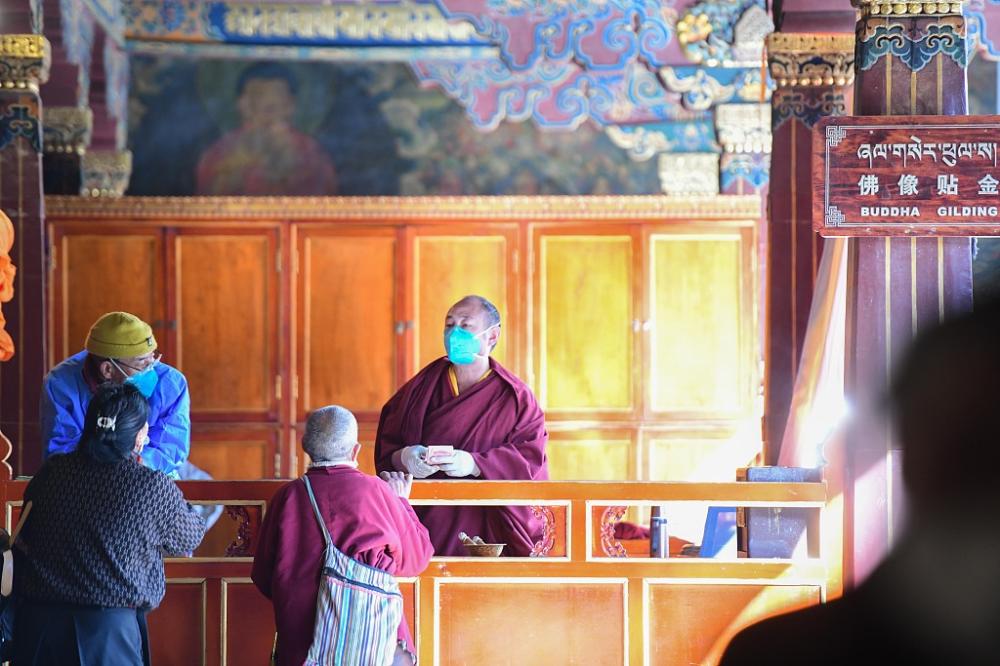
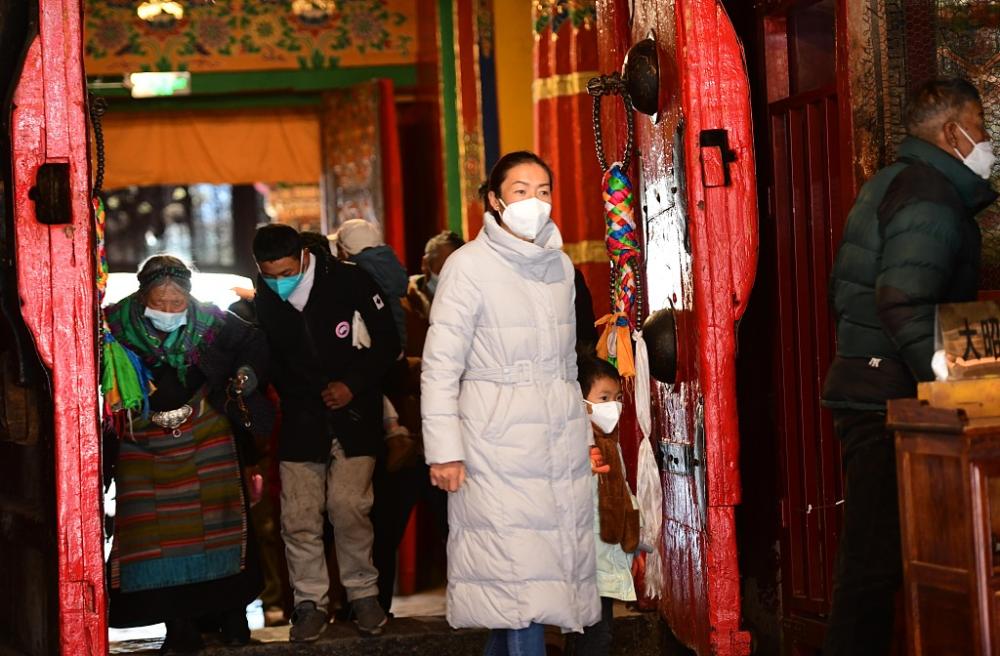
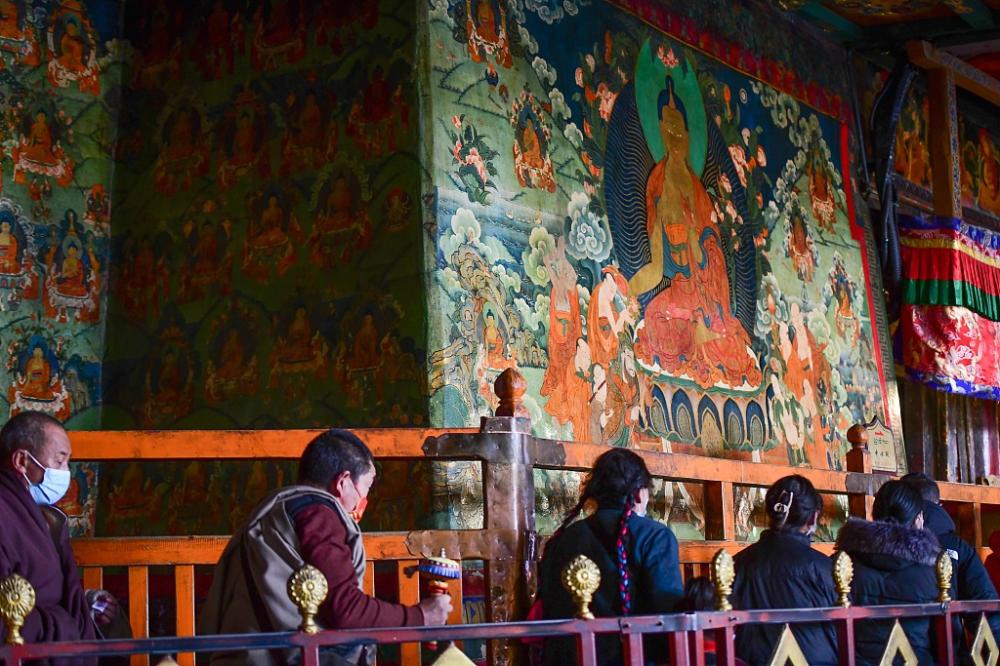
Der Johkang-Tempel in Lhasa ist ab Dienstag, dem 27. Dezember, wieder für Besucher zugänglich, nachdem er aufgrund der COVID-19-Pandemie fast fünf Monate geschlossen war.
(Quelle: CRI Deutsch)

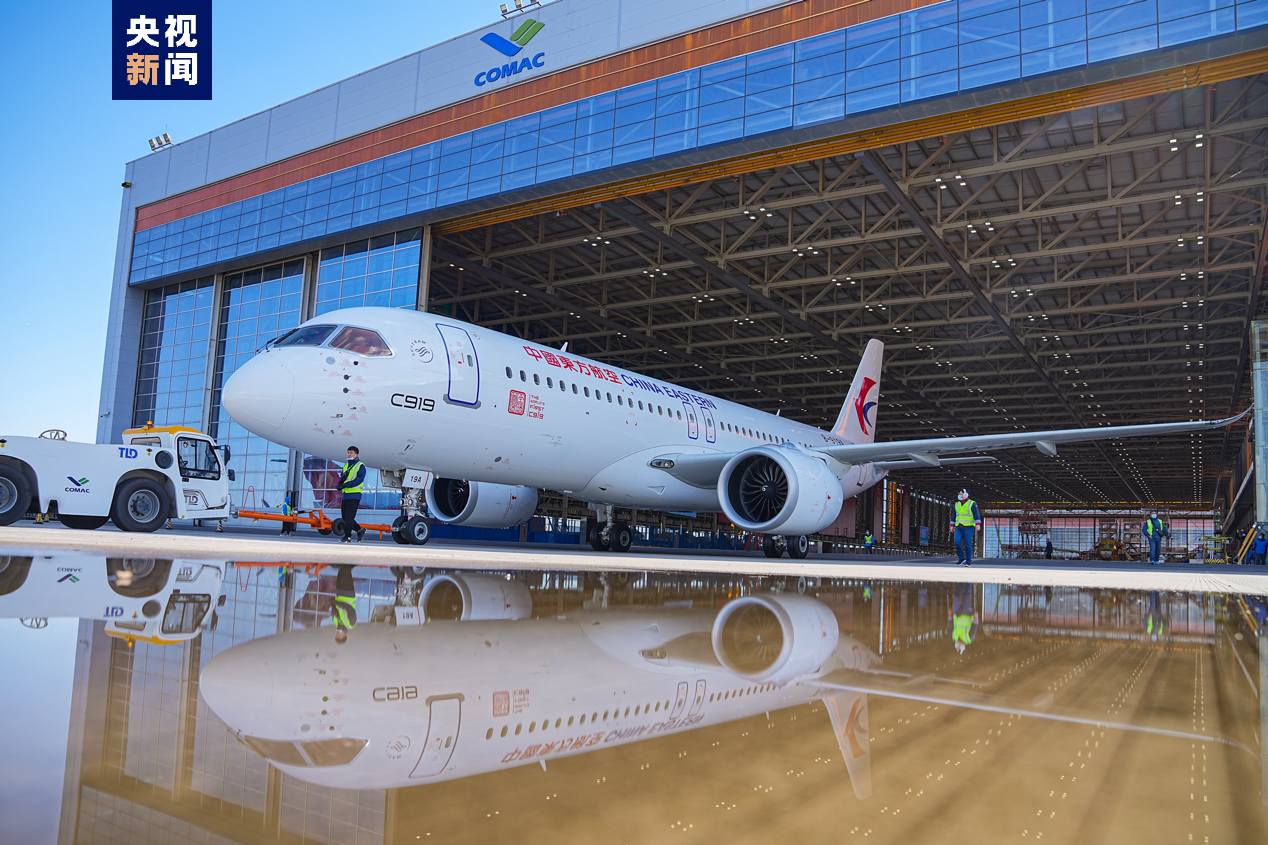
Die C919, das erste von China selbst entwickelte Großraumflugzeug, hat unlängst offiziell seinen 100-Stunden-Testflug begonnen. Nach dem erfolgreichen Abschluss dieses Testflugs wird die erste C919 voraussichtlich bereits im Frühjahr 2023 ihren kommerziellen Passagierbetrieb aufnehmen können.
Da die Zahl der Flugreisenden weltweit steigt – und in China besonders schnell wächst – wird die C919 Experten zufolge dazu beitragen, diese Nachfrage in gewissem Maße zu decken. Bislang liegen bereits 1.115 Bestellungen für die C919 aus dem In- und Ausland vor.
Die C919 ist vergleichbar mit dem Airbus A320 und der Boeing B737 und verfügt je nach Typ über 158 bis 168 Sitzplätze sowie eine Reichweite von 4.075 bis 5.555 Kilometern. Es ist das erste Single-Aisle-Flugzeug, das von chinesischen Ingenieuren selbst entwickelt wurde. Branchenkennern zufolge wird das Prädikat „Made in China“ in Zukunft noch öfter für große Passagierflugzeuge verwendet werden.
Es wird erwartet, dass die C919 zu einer beschleunigten Entwicklung der Luftfahrtindustrie in China beiträgt und die Monopolstellung von Boeing und Airbus gewissermaßen durchbricht.
Wu Guanghui, Chefdesigner der C919, sagt: „Chinas Nachfrage nach Passagierflugzeugen wird sich in den nächsten 20 Jahren voraussichtlich verdoppeln. Gleiches gilt wahrscheinlich auch für die globale Nachfrage. In diesem Fall sind wir als dritter Hersteller nach Boeing und Airbus in der Lage, den entsprechenden Markt zu besetzen. Schließlich brauchen unsere in- und ausländischen Kunden mehr Auswahlmöglichkeiten.“
Wang Yanan, Chefredakteur der Zeitschrift „Aerospace Knowledge“, erklärt: „Die Massenproduktion der C919 wird der chinesischen Luftfahrtindustrie helfen, in die weltweite Lieferkette für Großraumflugzeuge eingebunden zu werden. China wird in diesem Prozess wertvolle Erfahrung sammeln können.“
Am 29. November erhielt die C919 ihr Produktionszertifikat von der chinesischen Zivilluftfahrtbehörde (CAAC), was bedeutet, dass das Flugzeug auf der Grundlage eines genehmigten Qualitätskontrollsystems in die Massenproduktion gehen kann.
Bei dem nun gestarteten 100-Stunden-Testflug handelt es sich um eine endgültige Lufttüchtigkeitsbescheinigung, die eine Genehmigung für den kommerziellen Betrieb von Passagierflügen bedeutet. Für den Betrieb im Ausland benötigt die C919 außerdem Lufttüchtigkeitszeugnisse der Europäischen Agentur für Flugsicherheit (EASA) und der Federal Aviation Administration der Vereinigten Staaten (FAA).
Guo Yuqiang, stellvertretender Geschäftsführer der Zhongyuan Aviation Financial Leasing Co., die sich in Zhengzhou in der zentralchinesischen Provinz Henan angesiedelt hat, sagt: „Wir gehören zu den ersten Kunden der C919. Von der Unterzeichnung der Kaufverträge bis zur endgültigen Auslieferung der Flugzeuge vergehen normalerweise mehrere Jahre. Man kann daher also davon ausgehen, dass die Auswirkungen der COVID-19-Pandemie auf den inländischen Luftverkehrsmarkt nach diesem Zeitraum relativ gering sein dürften. Wir sehen die zukünftige Entwicklung also zuversichtlich.“
(Quelle: CRI Deutsch, CCTV)

Ab 8. Januar 2023 werden die Nukleinsäuretests für alle Einreisenden nach China entfallen. Dies teilte das Hauptzollamt der Volksrepublik China am Mittwoch mit. Stattdessen müssen bei der Einreise dem Zoll die Ergebnisse eines negativen Coronavirus-Nukleinsäuretests aus den letzten 48 Stunden vor der Einreise vorgelegt werden.
Darüber hinaus werden gemäß dieser Ankündigung dann auch die Anti-Corona-Nukleinsäure-Kontrollen und -tests für alle importierten Kühlketten- und Nicht-Kühlketten-Waren in den Grenzzollämtern entfallen.
Mit der kontinuierlichen Optimierung seiner COVID-19-Präventionsmaßnahmen hat China seine Wirtschaft schnell wiederbelebt. Die Verbindungen zwischen China und der Außenwelt sind auch ständig verstärkt worden. 2023 ist nach dem traditionellen chinesischen Mondkalender das Jahr des Hasen. Der Hase ist ein Symbol für Vitalität und Glück. Er verkörpert Wohlstand, Gesundheit und Ruhe. Im neuen Jahr wird China der Welt weiterhin positive Impulse und Stabilität bringen.
(Quelle: CRI Deutsch, pixabay)

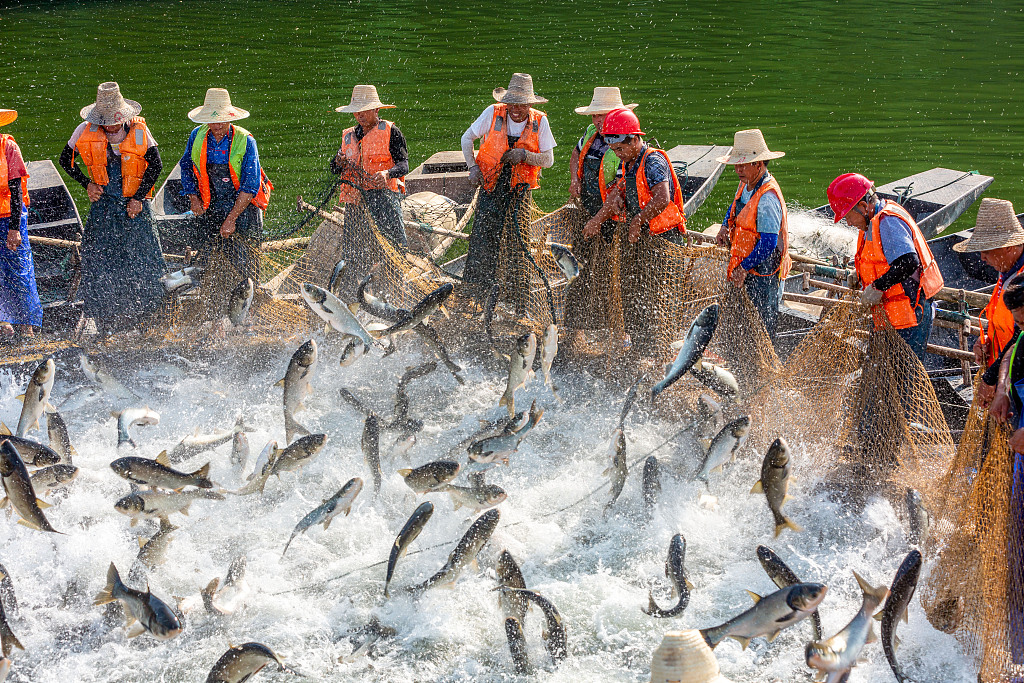
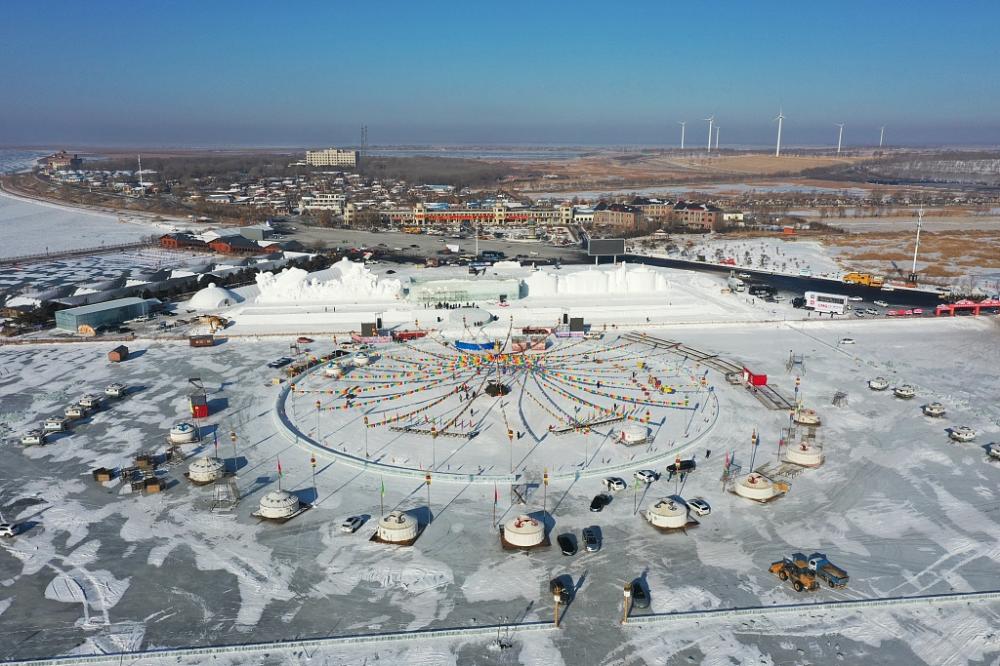
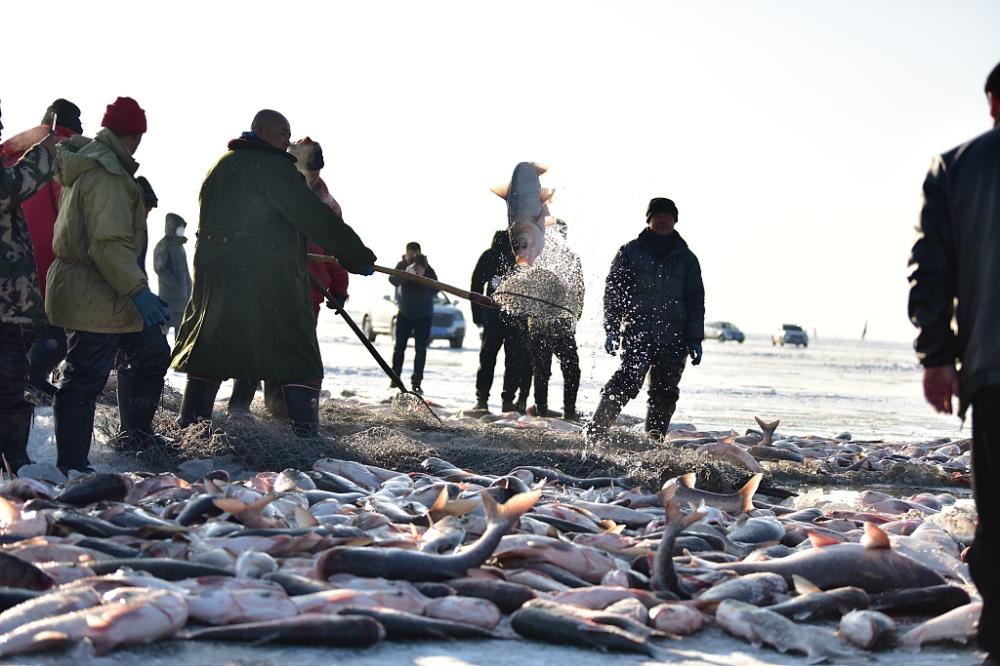
Jedes Jahr Ende Dezember beginnt das Winterfischen im Chagan-See in der nordostchinesischen Provinz Jilin. Dank dem Umweltschutz und wissenschaftlicher Fischerei gibt es im Chagan-See heute Dutzende von Fischarten und eine jährliche Produktion von 6.000 Tonnen frischem Fisch. Die diesjährige Winterfischerei-Saison dauert bis Februar 2023 und es wird mit einer Gesamtfangmenge von rund 1.500 Tonnen gerechnet.
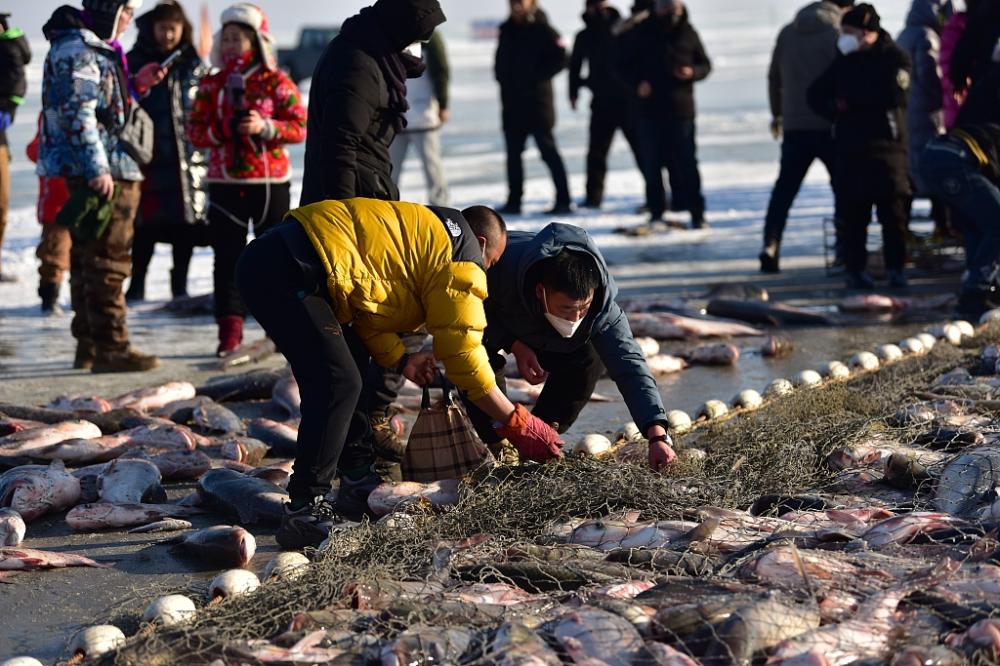
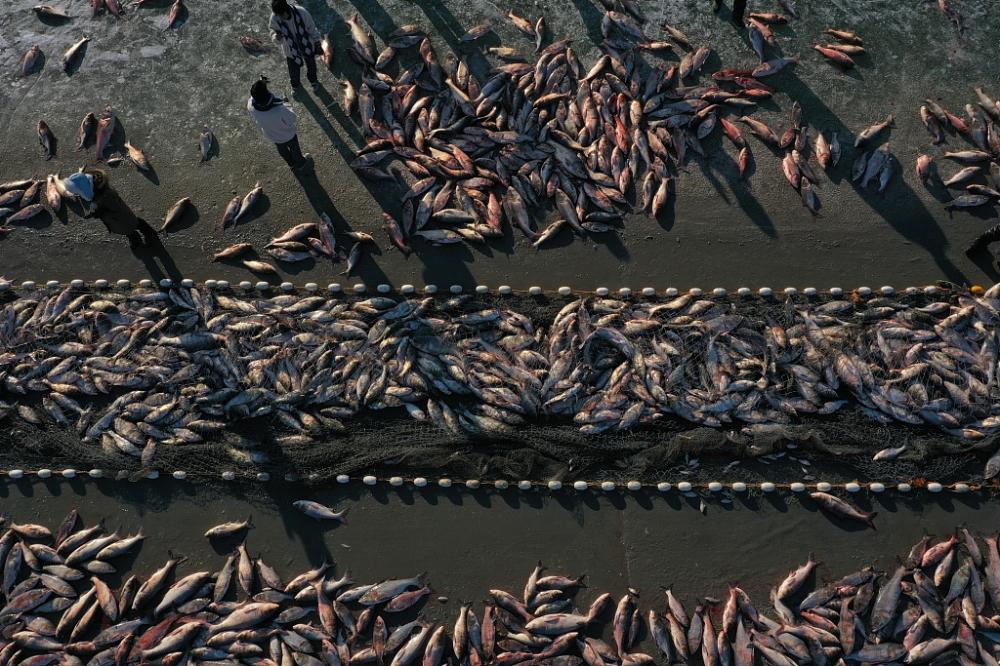
(Quelle: CRI Deutsch, VCG)

Am Samstag hat US-Präsident Joe Biden den National Defence Authorization Act for Fiscal Year 2023 (NDAA) unterzeichnet. Der Gesetzentwurf enthält zahlreiche Verleumdungen gegen China und sendet ein falsches Signal an die separatistischen Kräfte für die „Unabhängigkeit Taiwans“.
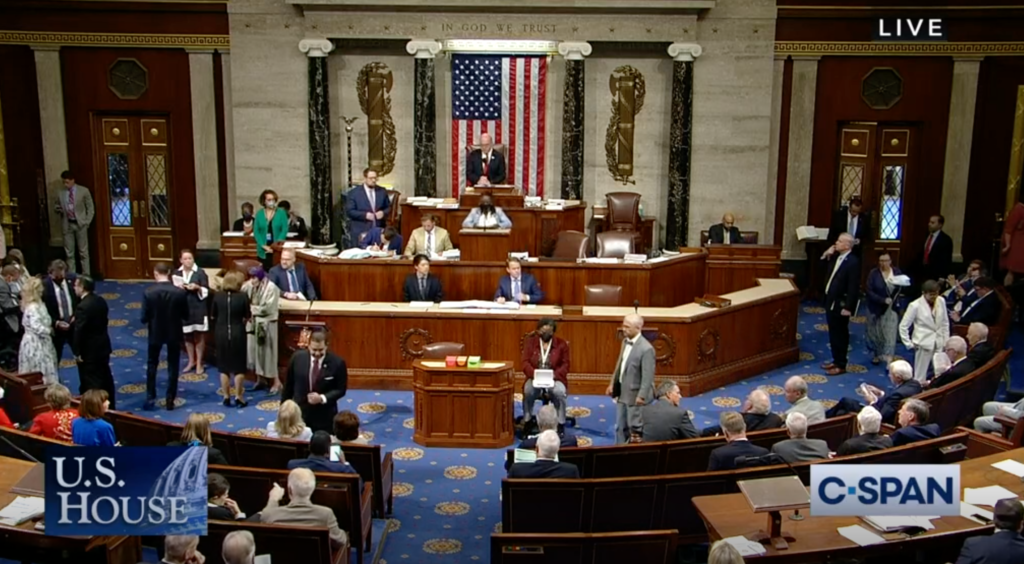
Der NDAA 2023 ist ein innerstaatliches Gesetz der Vereinigten Staaten, das eigentlich eine innerstaatliche Angelegenheit sein sollte. Sie setzt sich jedoch über internationales Recht hinweg und mischt sich eklatant in die inneren Angelegenheiten Chinas ein. In dem Gesetzentwurf wird behauptet, dass die US-Regierung über einen Zeitraum von fünf Jahren zehn Milliarden US-Dollar an „Militärhilfen“ und zwei Milliarden US-Dollar an „Militärkredite“ für Chinas Taiwan-Region bereitstellen wird, was zweifellos die Konfrontation zwischen den beiden Seiten der Taiwan-Straße fördert sowie bestätigt, dass die USA Frieden und Stabilität in der Taiwan-Straße stören und Sicherheitsrisiken in dieser schaffen will.

Erst vor einem halben Monat kündigte die Regierung von Joe Biden den siebten Waffenverkauf an Taiwan in den zwei Jahren seit ihrem Amtsantritt an. Der NDAA 2023 enthält auch negative Elemente wie die Erhöhung der Militärhilfen für Taiwan. All dies sind schwerwiegende Verstöße gegen das Ein-China-Prinzip sowie gegen die Bestimmungen der drei gemeinsamen Kommuniqués zwischen China und den USA sowie gegen die politischen Verpflichtungen, die die USA gegenüber China eingegangen sind. Ein Teil der Öffentlichkeit auf der Insel Taiwan hat darauf hingewiesen, dass die US-Waffenverkäufe an Taiwan keineswegs auf die Wahrung der Interessen Taiwans abzielen, sondern vielmehr darauf, Taiwan langfristig als Geldautomat und Spielball der USA zu nutzen.
Bei dem Treffen zwischen den Staatsoberhäuptern Chinas und der USA auf Bali im vergangenen Monat machte China deutlich, dass die Taiwan-Frage den Kern der chinesischen Interessen, die Grundlage der politischen Basis der chinesisch-amerikanischen Beziehungen sowie die erste rote Linie in den bilateralen Beziehungen darstellt, die nicht überschritten werden darf. Präsident Biden erklärte, dass die USA die Situationen von „zwei Chinas“ oder „ein China, ein Taiwan“ nicht unterstützen. Außerdem wollten die USA keine Abkopplung von China. Jedoch haben die USA keine politische Glaubwürdigkeit in ihrem Handeln.
Taiwan gehört zu China und die Lösung der Taiwan-Frage ist eine Angelegenheit des chinesischen Volkes selbst, in die sich das Ausland nicht einmischen darf. Am Sonntag organisierte das östliche Kommando der Volksbefreiungsarmee Chinas gemeinsame Kampfbereitschaftspatrouillen und gemeinsame Feuerschlagübungen im See- und Luftraum rund um die Insel Taiwan. Dies ist eine entschlossene Antwort auf die auf die aktuelle Eskalationsprovokation von den USA und Taiwan.
(Quelle: CRI Deutsch)

Die Redaktion dieser Plattform hat sich das Ziel gesetzt, eine große Vielfalt an Meinungen zu präsentieren, um den Leserinnen und Lesern die Möglichkeit zu geben, sich selbst sich selbst zu informieren und eine eigene Meinung zu bilden. Sowohl positive als auch kritische Nachrichten, Berichte oder Kommentare sind willkommen und werden wertgeschätzt. Alle Beiträge bemühen sich weiterhin, um einen respektvollen und höflichen Umgangston. (Medienprojekt von VANA)
Kontaktieren Sie uns: info@tendenzblick.net
© Copyright - TB - Aktuelle Nachrichten online